Search for D2C benchmarks and the same tired numbers surface every time. A blended ROAS of 3.0 is "healthy." A $30 CAC is the line you should not cross. Email should drive 30% of revenue. Every one of those figures was built on US DTC brands: US CPMs, card-first checkout, cheap shipping, and return rates under 10%.
Indian D2C runs on a different machine. Cash on delivery still carries close to half of most orders. Tier 2 and Tier 3 cities drive the growth. Festival season inflates media costs for six weeks straight. And RTO, return to origin, quietly adds 20-30% on top of the acquisition cost your ad platform reports. Run an Indian brand against a US benchmark and you will misread every call: how much to spend, which platform to weight, even which category to enter.
This post fixes that. The table below is the summary page of our internal benchmark report, built from ₹100+ crore of annual ad spend we manage across Meta and Google for Indian D2C brands. Twelve categories, real ROAS ranges on both platforms, and the COD and RTO numbers almost nobody publishes. If you want all 49 pages, with subcategory-level CPM, CTR, CPC and CPP data, grab the full India D2C benchmarks report.
How These Numbers Were Built
Every figure in this post comes from live ad accounts, not surveys. Across the ₹100+ crore we manage, we pulled anonymized performance data from the brands we run on Meta and Google over the last twelve months, bucketed it by category, and cut the ranges you see below. No client names, and no single-brand outliers driving the numbers.
We publish ranges, not single points, on purpose. Inside one category the spread is wide. In Beauty & Personal Care, a men's grooming brand running creator UGC and a fragrance brand shooting studio catalog content both live in the same bucket, and their numbers barely overlap. A single-point benchmark is usually someone's average pretending to be advice. A range shows you the floor and the ceiling, which is what you actually need to know about your own account.
Ranges also protect you from timing noise. A brand that spent through Diwali and a brand that sat it out will report numbers from different planets, so we cut the extremes at both ends before publishing. What remains is the steady-state band you can actually plan against, with festival spikes handled separately in the seasonality section below.
One honest caveat: these are platform-reported numbers. Meta and Google both take credit for the same orders, so treat the table as a directional map of auction economics, not as accounting. For accounting, use your own blended numbers, which we covered in the DTC metrics dashboard post.
The Master Table: ROAS, COD and RTO by Category
Here is the summary table. Twelve categories, Meta and Google ROAS ranges, plus average COD share and average RTO. This is your starting point for budget allocation and platform strategy, and the graphic below shows six of the twelve rows at a glance.
| Category | Meta ROAS | Google ROAS | Avg COD | Avg RTO |
|---|---|---|---|---|
| Fashion & Apparel | 2.8x-4.2x | 3.5x-5.0x | 50-60% | 20-30% |
| Beauty & Personal Care | 3.0x-5.0x | 3.5x-5.5x | 38-48% | 14-20% |
| Health & Supplements | 3.5x-6.0x | 4.0x-6.5x | 40-50% | 15-22% |
| Home & Living | 2.8x-4.5x | 3.8x-5.8x | 40-50% | 15-22% |
| Electronics | 2.2x-3.8x | 3.0x-4.5x | 35-45% | 10-16% |
| Food & Beverage | 2.8x-4.5x | 3.2x-5.0x | 42-52% | 14-22% |
| Baby & Kids | 3.2x-5.0x | 3.5x-5.2x | 45-55% | 16-24% |
| Pet Products | 3.5x-5.5x | 3.8x-5.8x | 38-48% | 14-20% |
| Fitness & Sports | 2.8x-4.8x | 3.2x-5.2x | 40-50% | 15-22% |
| Books & Education | 3.0x-5.0x | 3.5x-5.5x | 32-42% | 10-16% |
| Jewelry & Accessories | 2.8x-4.5x | 3.2x-5.0x | 45-55% | 18-26% |
| Subscription Boxes* | 1.8x-3.5x | 2.2x-4.0x | 35-45% | 12-18% |
*First-order ROAS. On a six-month LTV basis, subscription boxes run 4.5x-8.5x, the best adjusted number in the table.
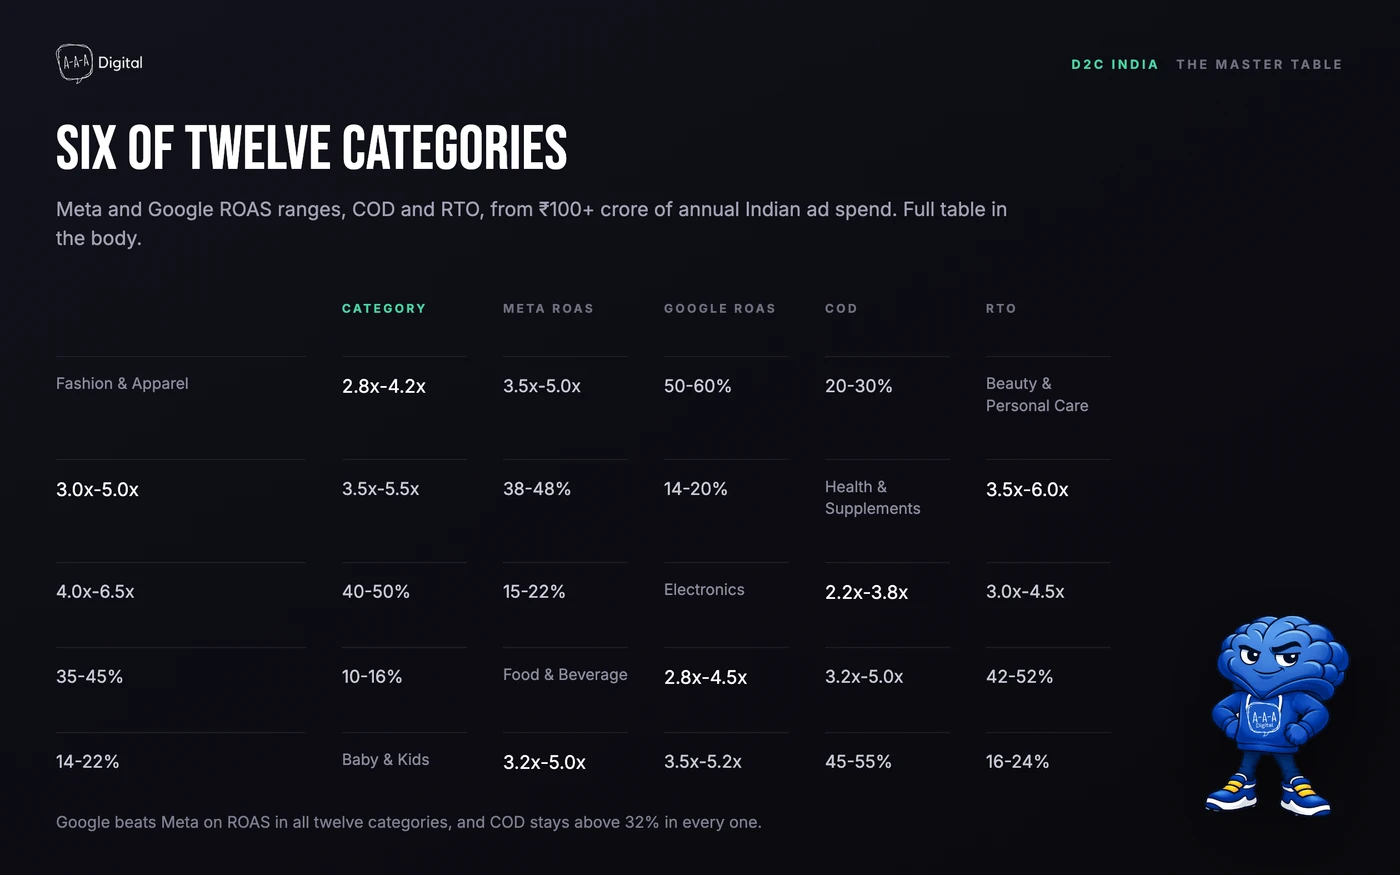
Three things jump out when you read the full table. First, Google clears Meta on ROAS in all twelve categories, which we will get to in the platform section. Second, the spread between categories is enormous: Health & Supplements tops the table at 3.5x-6.0x Meta ROAS while Electronics sits at 2.2x-3.8x. Third, COD and RTO are the real story. Fashion & Apparel runs 50-60% COD and 20-30% RTO, which is why it is the largest D2C segment by volume and also the one with the most broken unit economics.
How to Read Your Own Number Against the Range
Treat the table as a diagnostic, not a scoreboard. When a founder tells us their ROAS is 2.5x, our first question is never "is that good?" It is "which category, which platform, what CPM?" The range tells you what to do next, and the rules are consistent across the ₹100+ crore we manage.
Below the range means a creative problem. If your category runs 3.0x-5.0x and you are sitting at 2.2x, the auction is not the issue. Your hooks, offers, or formats are. Fix creative before you touch budgets, because scaling weak creative just loses money with more zeros attached.
Inside the range means protect and optimize. Hold spend steady and push the levers that move you up the band: average order value, COD reduction, and landing page conversion. This is where most healthy accounts live, and where steady compounding happens.
Above the range means scale before CPMs catch up. If you are beating the ceiling, you have a window, not a victory. Competitors copy winners and auction inflation follows, usually within a quarter. Push budget aggressively while the economics hold, and watch the range, not your ego.
Two context checks before you act on any of this. First, CPM sets the difficulty level: the same creative wins at a ₹60 CPM and loses at ₹140, so compare your CPM against your category band before blaming the ad. Second, accounts under six months old should expect to sit at the bottom of their range while pixel data and creative learnings accumulate; the range is a destination, not a starting point.
The habit that makes this framework work is tracking weekly rather than monthly. A benchmark read once a quarter changes nothing; a benchmark read against your own trend every Monday changes budgets.
COD, RTO and the True CAC Formula
Now the number that decides whether Indian D2C actually makes money. Your ad platform reports a cost per purchase. In India, a purchase is not a delivered order. With COD, some share of buyers refuses delivery or never answers the door, and the courier sends the parcel back. That share is RTO.
Most founders read the reported CPP as their CAC. In our accounts, that is the single most common and most expensive misreading in Indian e-commerce. The correction is one line:
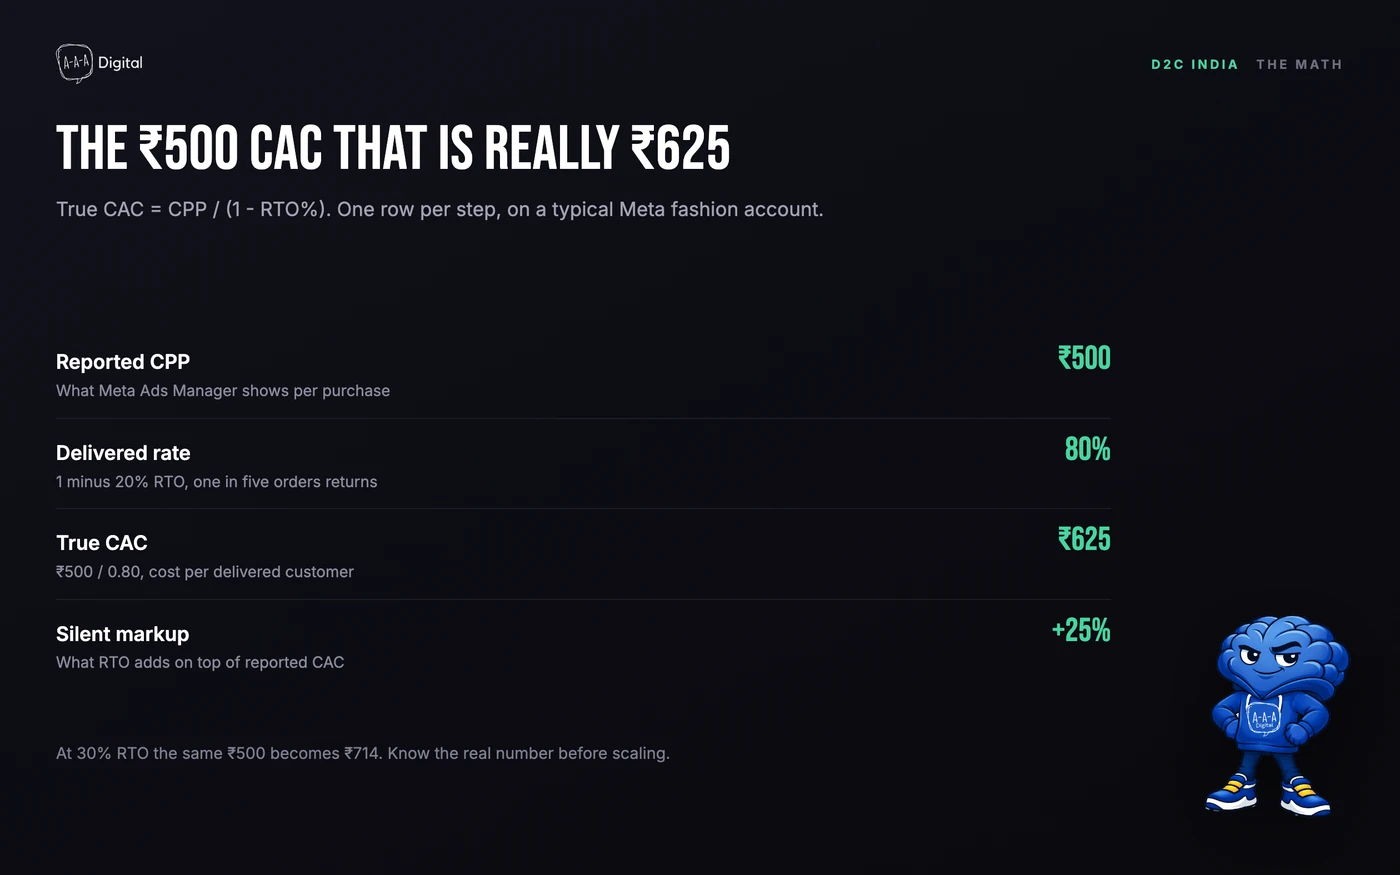
True CAC = CPP / (1 - RTO%)
Take a typical Meta fashion account. Ads Manager says ₹500 per purchase. With 20% RTO, one in five purchases never gets delivered, so divide ₹500 by 0.80 and you get ₹625. That is your true cost per delivered customer. The silent markup is 25%, and it never appears in Ads Manager. At fashion-category RTO of 30%, the same ₹500 becomes ₹714 before a single rupee of product cost.
For context, blended CAC for fashion D2C in India typically runs ₹280-₹520 before that adjustment. After it, the top of the band is well past ₹650. If you want the full framework around acquisition costs, we broke it down in our customer acquisition cost for e-commerce guide.
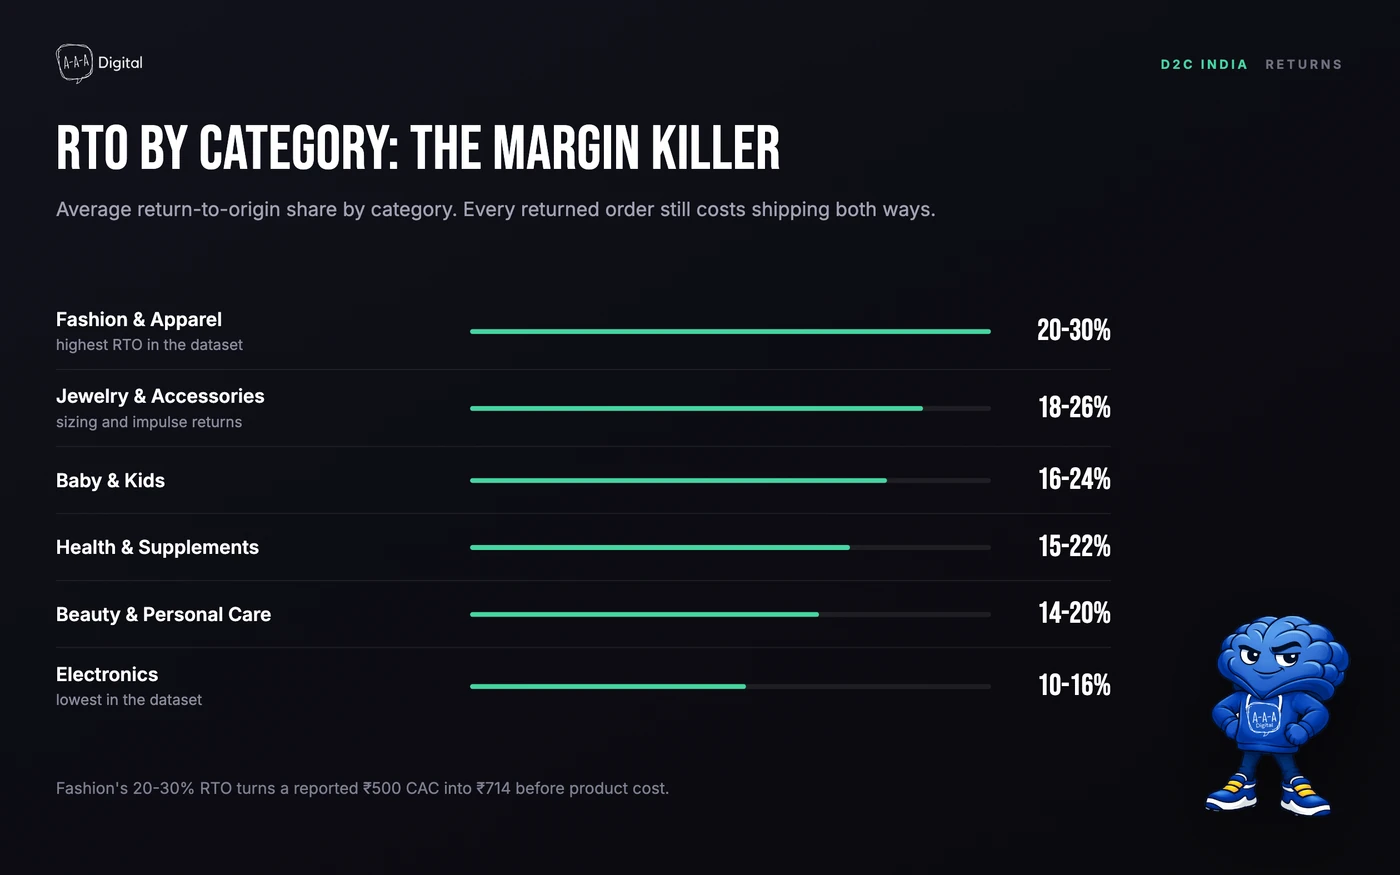
What actually moves COD and RTO. A 10% prepaid discount routinely pushes COD share below 30%, and prepaid orders drop to 8-10% RTO because a paid buyer is a committed buyer. AI-based COD verification calls before dispatch catch refusal-prone orders. Limiting COD to Tier 1 pin codes is harsh but effective for high-RTO catalogs. Every point of RTO you remove flows straight to contribution margin, which compounds if you are also working on e-commerce margin improvement.
Platform Strategy: Meta vs Google in India
Meta is the volume engine. Across our accounts, Meta CPMs run ₹50-110 for prospecting, and the platform's targeting, lookalikes, and creative formats carry most new customer acquisition for Indian D2C. Advantage+ shopping campaigns add another 20-30% on ROAS for catalogs with 30 or more SKUs, which is why fashion and home brands with deep catalogs should be on them by default.
Google is the efficiency engine. It delivers 15-25% better ROAS than Meta across our account set, but at 20-40% higher CPC, so it rewards precision over volume. Branded search and Google Shopping harvest intent that Meta created; neither platform wins alone. Our default mixes reflect that: roughly 70% Meta and 30% Google for Beauty & Personal Care, 80% Meta and 20% Google Shopping for Fashion.
The pattern we see most when we audit struggling accounts is not a platform choice problem but a structure problem: too many ad groups fighting over the same audience, no catalog retargeting, prospecting and retargeting budgets blended into one number nobody can read. Fashion retargeting through dynamic catalog ads runs 4.5x-6.0x ROAS against 2.8x-3.5x for cold prospecting in the same accounts, yet half the stores we audit have it underfunded. The second gap is creative volume: our winning accounts ship ten to fifteen new creatives a month per catalog, while struggling accounts run three ads for six weeks and wonder why frequency climbed and ROAS sagged. Benchmarks without a creative production plan are wishes. If your team does not have the bandwidth to run this structure properly, that is the work our performance marketing service handles day to day.
Seasonality: The Festival Curve
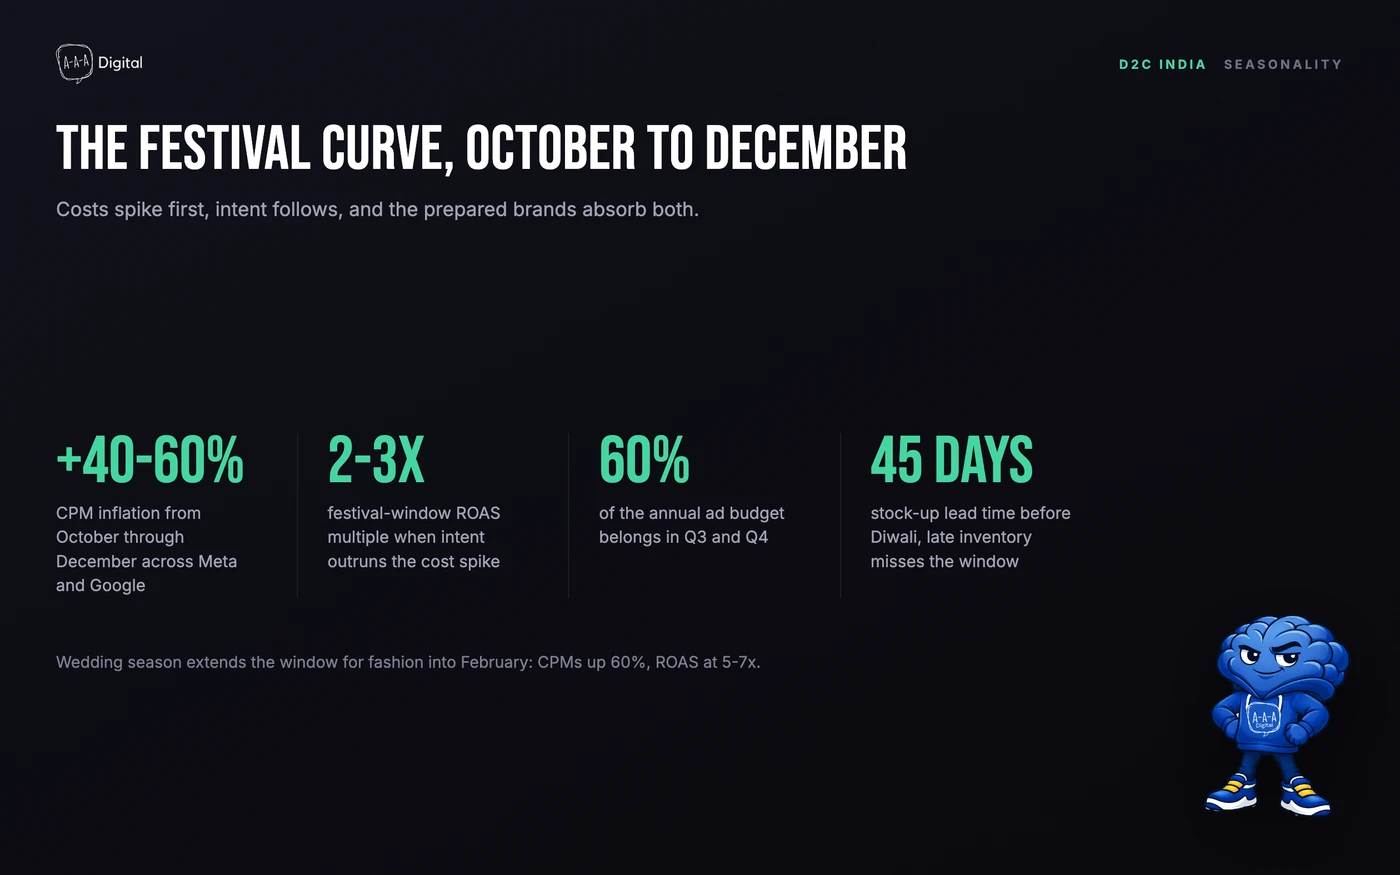
Indian media costs do not move in a straight line. CPMs rise 40-60% from October through December across Meta and Google. Yet festival-window ROAS runs 2-3x normal, because purchase intent spikes harder than costs. The brands that win the quarter plan for it in July, not in October.
The window runs longer than most founders expect. For Beauty & Personal Care, Diwali plus wedding season means 2.5x volume from October through January, and we tell clients to stock 45 days early. For Fashion, wedding season extends into February, ethnic wear CPMs spike 60%, and ROAS hits 5-7x on the same catalog that does 3.5x in August. Electronics and Books peak around Diwali gifting and then go quiet.
The budget shape that follows: put 60% of your annual ad budget into Q3 and Q4, build your creative pipeline by September, and resist the urge to chase cheap CPMs in January. The founders who panic-spend in October pay the highest CPMs of the year for the least prepared creative.
Regional Creative: The Cheapest CPC Cut in India
English creative is the expensive default. In Tier 2 and Tier 3 cities, ads in Hindi, Tamil, Telugu, Bengali, and Marathi run 20-30% lower CPC than the same product advertised in English. In our Beauty & Personal Care accounts, regional creative outperforms English by 20-30% in Tier 2 and Tier 3 cities, and it is the closest thing to free performance we have found on Meta.
The catch: it is not translation. Winning regional creative is cast in the language, voiced in the language, and shot for the context, a Tamil skincare ad that looks like Chennai, not like a Mumbai ad with swapped subtitles. Influencer whitelisting ads take this further, delivering 40-60% higher ROAS than studio-shot content in the same category. If your next creative brief is English-only, you are paying a 20-30% CPC tax in exactly the markets where Indian D2C growth is happening.
FAQ
What is a good ROAS for D2C in India?
It depends on your category, which is the whole point of the master table. Health & Supplements brands should expect 3.5x-6.0x on Meta, while Electronics runs 2.2x-3.8x, and both can be healthy for their category. Read your number against the range before judging it, and check blended ROAS alongside platform-reported numbers.
Why is my CAC higher than benchmark tables suggest?
Probably because the table shows CPP and your account carries RTO you have not priced in. With 20% RTO, a reported ₹500 CAC is really ₹625 per delivered customer. Adjust for RTO first, then compare. If true CAC is still high after the adjustment, the usual suspects are creative fatigue and rising CPMs.
Which platform is better for Indian D2C, Meta or Google?
Neither wins alone. Meta carries volume at ₹50-110 prospecting CPMs, and Advantage+ adds 20-30% ROAS for deep catalogs. Google delivers 15-25% better ROAS at 20-40% higher CPC. Most of our accounts run 60-80% Meta depending on category, with Google harvesting the intent Meta creates.
How do festival months change these numbers?
From October through December, CPMs rise 40-60% but festival-window ROAS runs 2-3x normal, so prepared brands spend more, not less. Put 60% of your annual budget into Q3 and Q4, stock 45 days before Diwali, and have your creative pipeline ready by September. January CPMs are cheap because demand is quiet, not because you found an arbitrage.
Get the Full 49-Page Report
This post is the summary page. The full India D2C benchmarks report carries subcategory-level CPM, CTR, CPC, CPP, ROAS, COD, and RTO for all twelve categories, the platform playbooks we run, and tier-wise data beyond the big metros. If you are planning budgets, pitches, or a category entry for 2026, start there.
