Every Monday, without fail, we open the same eight numbers for every DTC brand we manage. Not thirty. Not the entire Shopify analytics dashboard. Eight. Over the years we've found that dtc metrics beyond that shortlist mostly create noise, and noise makes founders react to the wrong things.
The pattern is always the same when a store comes to us struggling. Revenue looks fine on the surface, but the founder is flying blind underneath. They can tell you the total sales number, and nothing else. Ask them what their contribution margin was last month, or what percentage of revenue comes from email, and you get a blank stare.
That's the problem this post solves. You'll walk away with the exact weekly scorecard we use, where to find each number in Shopify and your ad platforms, what "good" looks like, and which metric to panic about first when something slips.
Why Most Dashboards Fail You
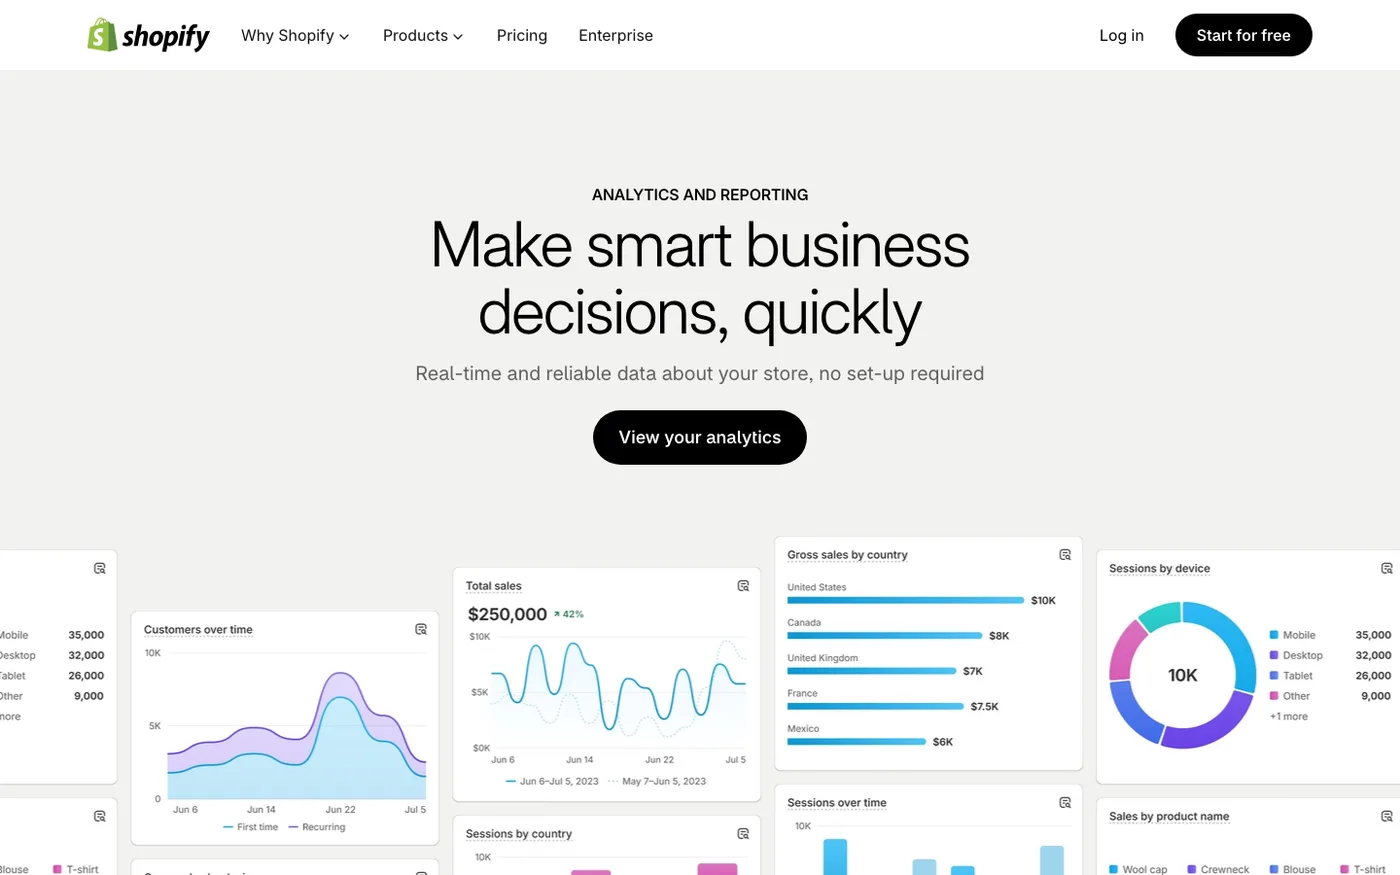
Shopify gives you hundreds of metrics. Google Analytics 4 gives you thousands. Klaviyo, Meta, Google Ads, TikTok, each one wants to show you a dozen charts and a "score" that means nothing.
The issue isn't data. It's signal versus noise. Most of those numbers are outputs of a handful of inputs. If your blended ROAS is dropping, you don't need to stare at twenty charts to figure out why. You need to check four or five leading indicators that tell you where the leak is.
We learned this the hard way. Early on we'd send clients twelve-page weekly reports. Nobody read them. The stores that grew fastest were the ones where the founder could recite five numbers from memory and knew exactly which lever to pull when one moved. So we cut the report down, and cut again, until only eight survived.
Here is the shortlist, in the order we'd check them.
1. Blended ROAS (MER)
Revenue divided by total ad spend, across every channel. Not Meta ROAS, not Google ROAS. Blended.
Platform-reported ROAS lies to you. It double-counts, it credits itself for branded search, and it got worse after iOS 14.5 broke most of the tracking pixels relied on. Your blended ROAS, also called marketing efficiency ratio, is the only version grounded in reality because it uses money in and money out.
Where to find it: Shopify total sales divided by total spend from Meta Ads Manager, Google Ads, and any other channel. We keep a simple spreadsheet. Fancy BI tools are optional.
Healthy range for most DTC brands: 3.0 to 5.0. Below 2.5 for more than two weeks and something is structurally wrong, either your creative, your offer, or your margins.
2. New Customer Acquisition Cost (nCAC)
Total ad spend divided by first-time customers, not total customers. This is the metric your Meta dashboard can't show you accurately, so you have to compute it yourself.
If you blend returning customers into CAC, the number looks better every month as your brand grows, and you won't notice your ads quietly getting less efficient. We've audited stores where the blended CAC looked fine but the new customer CAC had doubled over six months. The founders had no idea.
Where to find it: Shopify's "First-time customers" report under Analytics > Reports, against total spend. Track it weekly, compare month over month.
When nCAC rises, the usual suspects are creative fatigue (swap your ads before touching budgets), rising CPMs (test new audiences and placements), or a landing page that's stopped converting.
3. Conversion Rate
Sessions to purchase. Simple, boring, and the number that decides whether everything else works.
A 2% conversion rate and a 3% conversion rate are the difference between a business that prints money and one that struggles at the exact same ad spend. Yet most founders check it once a quarter. Check it weekly. Segment it by device, because a store converting at 3.5% on desktop and 1.1% on mobile has a mobile problem, not a traffic problem.
If this number drops suddenly, don't touch your ads first. Check for broken checkout (a theme update or app conflict), a shipping rate change, or a site speed regression. Run PageSpeed Insights if mobile conversion dipped after any theme change. Nine times out of ten the cause is on-site, not in the ad account. We see this pattern so often we wrote a whole post on why performance marketing fails when the store itself is the bottleneck.
4. Average Order Value (AOV)
Revenue divided by orders. Your cheapest growth lever, because raising AOV drops your effective CAC without spending an extra rupee or dollar on ads.
Ways to move it: bundles, volume discounts, a free-shipping threshold set 15–25% above your current AOV, post-purchase upsells, and tiered pricing. Shopify's native discount engine handles most of this, or apps like Vitals or Rebuy if you want more control. Be careful with upsell apps that slow down your checkout, though. We've pulled more than one because the 200ms they added to load time cost more conversions than the upsell generated.
Watch AOV alongside discount rate. If AOV rises because you're training customers to wait for 30% off codes, you haven't improved anything.
5. Contribution Margin Per Order
This is the one that separates grown-ups from hobbyists. Revenue per order, minus product cost, shipping, payment processing, fulfillment, and expected returns. Not revenue. Not gross margin. What actually lands in your account per order.
We push every client to compute this at least monthly, because ad spend decisions are impossible without it. If your contribution margin is $22 and your nCAC is $30, no amount of "brand building" fixes that math. You either raise prices, cut costs, or improve retention.
Returns deserve real attention here, especially in apparel and footwear. A brand doing $2M with a 25% return rate is a fundamentally different business than one at 8%, and most founders genuinely don't know their number.
6. Email and SMS Revenue Share
Revenue from Klaviyo flows as a percentage of total revenue. For a healthy DTC brand, this should sit between 25% and 35%.
If it's under 15%, you're renting your entire customer base from ad platforms, and the landlords keep raising rent. Build the flows first: welcome series, abandoned cart, abandoned checkout, post-purchase, winback. Flows are set-and-forget revenue. Campaigns are weekly work. Get flows producing 60–70% of your email revenue before you obsess over campaign calendars.
If you don't know this number, Klaviyo's analytics tab shows attributed revenue. Compare it to Shopify's total. Takes five minutes, and it tells you whether your retention engine exists or not.
7. Repeat Purchase Rate and LTV:CAC
What percentage of customers come back to buy again within 90 or 180 days, and how the lifetime value of a customer compares to what you paid to acquire them.
The ratio to remember: LTV:CAC of 3:1 or better means the model works. Below that, growth is being bought at a loss. For consumables and supplements, repeat rate is everything; a customer acquired at breakeven who buys four times a year is a great deal. For one-time-purchase categories like furniture, every order needs to stand on its own.
Retention work is unglamorous. Post-purchase email flows, replenishment reminders, loyalty programs, better packaging with a card that brings people back. It compounds quietly while you sleep.
8. Site Speed (Core Web Vitals)
Not a revenue metric, but it moves every revenue metric. Check your LCP, CLS, and INP weekly with PageSpeed Insights, or set up a weekly Lighthouse run through a tool like SpeedCurve or Calibre.
Speed regressions almost always come from app installs. Each new app adds scripts to your storefront, and store owners install them like candy. Every quarter, audit your installed apps and uninstall anything not actively earning its place. We've seen stores drop two full seconds of load time just by removing dead apps, and conversion followed.
If your ads were performing last month and tanked this month, check speed before you blame the algorithm. This trap has burned more of our clients than any other, and it's usually invisible until you look.
The Weekly Routine: Reviewing Your DTC Metrics in 30 Minutes
Thirty minutes, every Monday, in this order:
- Blended ROAS and nCAC (is acquisition efficient?)
- Conversion rate by device (is the store converting?)
- AOV and discount rate (are orders getting bigger or just cheaper?)
- Contribution margin check (does the math still work?)
- Email revenue share (is retention compounding?)
- Repeat rate (are customers coming back?)
- Core Web Vitals (did anything break?)
Write the numbers in a spreadsheet. Next to each, one cell for "why it moved." That single habit, the one-line explanation, is worth more than any dashboard because it forces you to understand your business instead of watching it.
What "Good" Looks Like by Stage
Early stage (under $50K/month): obsessed with nCAC and conversion rate. Nothing else matters until acquisition works.
Growth stage ($50K–$500K/month): blended ROAS, AOV, and email share become the battleground. This is where most of our DTC growth work focuses.
Scale stage ($500K+/month): contribution margin and LTV:CAC decide everything. Brands die at this stage from margins, not marketing.
Frequently Asked Questions
How often should I check these DTC metrics?
Weekly for all eight, with a deeper monthly review of contribution margin and cohort-based LTV. Daily checking makes you overreact to noise. A single bad Tuesday means nothing; three bad Tuesdays in a row is a trend worth acting on.
Should I use a dashboard tool like Triple Whale or Northbeam?
They're useful once you're spending $50K+/month on ads and platform attribution genuinely can't keep up. Below that, a spreadsheet with the eight numbers above beats a $1,000/month tool. Spend the money on creative instead.
What's the single most important metric if I can only track one?
Blended ROAS. It compresses ad efficiency, conversion rate, and AOV into one honest number. But be careful: a store can have great blended ROAS and still be dying if repeat rate is zero. That's why it's eight metrics, not one.
My ROAS is fine but profit is down. What's happening?
Almost always one of three things: discounting crept up, shipping costs rose, or return rate climbed. Pull your contribution margin per order for the last 90 days and compare it to the prior quarter. The leak shows up there.
Do these metrics change for Shopify Plus stores?
The framework holds, but Plus adds checkout customization metrics (checkout completion rate, Shop Pay share) and higher stakes on speed, since Plus stores usually carry more apps and scripts. The eight still come first.
Get Help With This
If you'd rather have a team that lives in these numbers run this scorecard for you, that's what we do. Our performance marketing service covers weekly metric reporting, creative iteration, and full-funnel optimization for DTC brands, we've launched 200+ Shopify stores and we know which levers move which numbers.
