
You are spending $10,000 a month on Meta and Google Ads. Your agency sends you a PDF every Friday with colourful charts showing "impressions up 40%" and "CTR at 2.3%."
But your revenue? Flat. Your ROAS? Below 2.0. Your CFO is asking questions you do not have answers to.
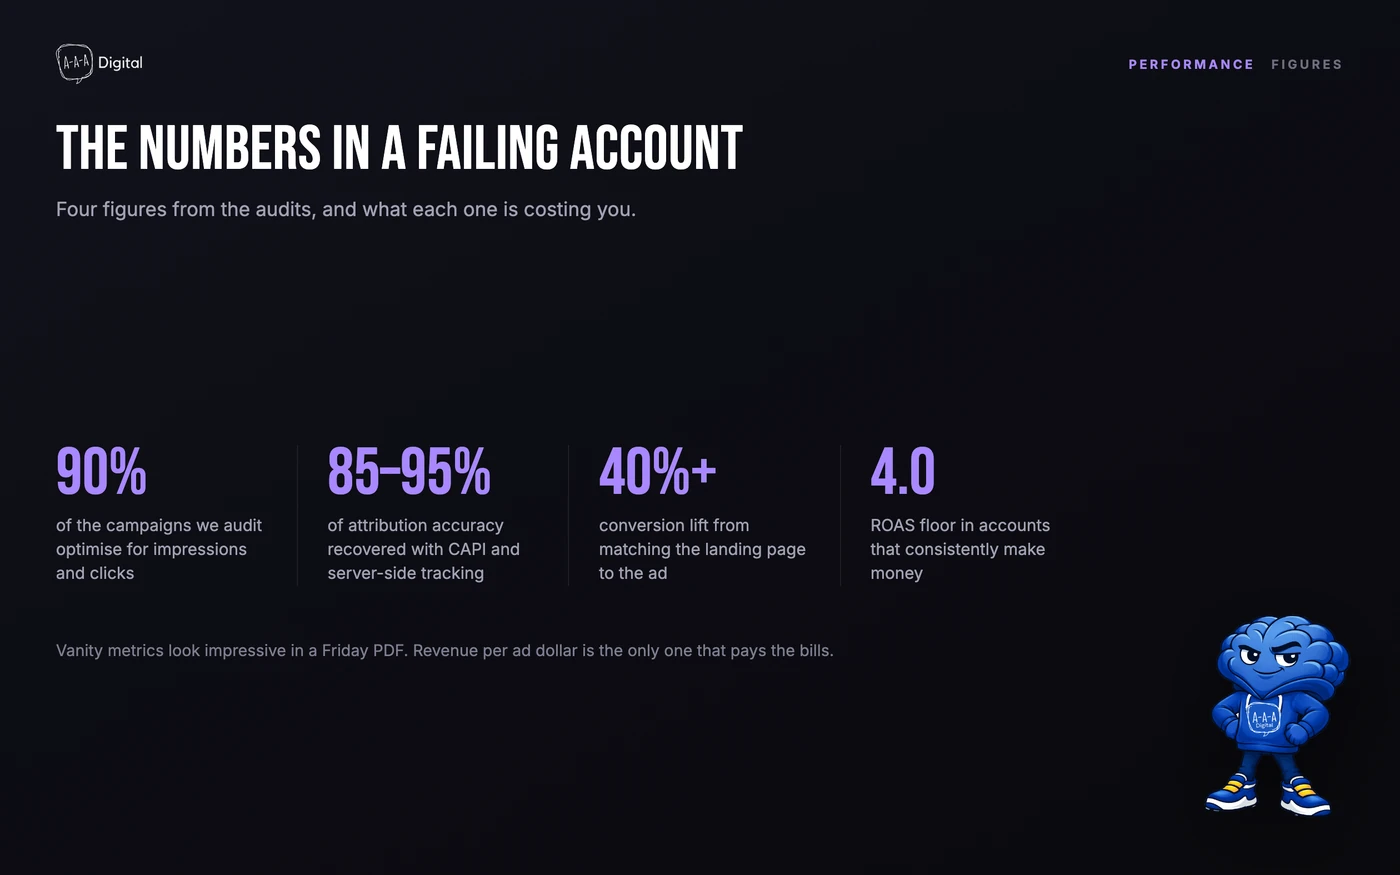
This is the story of 90% of performance marketing campaigns we audit. And the reason is almost never "the platform changed the algorithm."
The Real Problem: You Are Optimising for Vanity Metrics
Most agencies report on what looks good, not what drives revenue. They optimise for:
- Impressions: because big numbers look impressive
- Clicks: because they are easy to generate with broad targeting
- Engagement rate: because it makes the creative team look good
None of these pay your bills. The only metric that matters is revenue per ad dollar spent.
The Three-Layer Audit Framework
When we audit a failing account, we look at three layers:
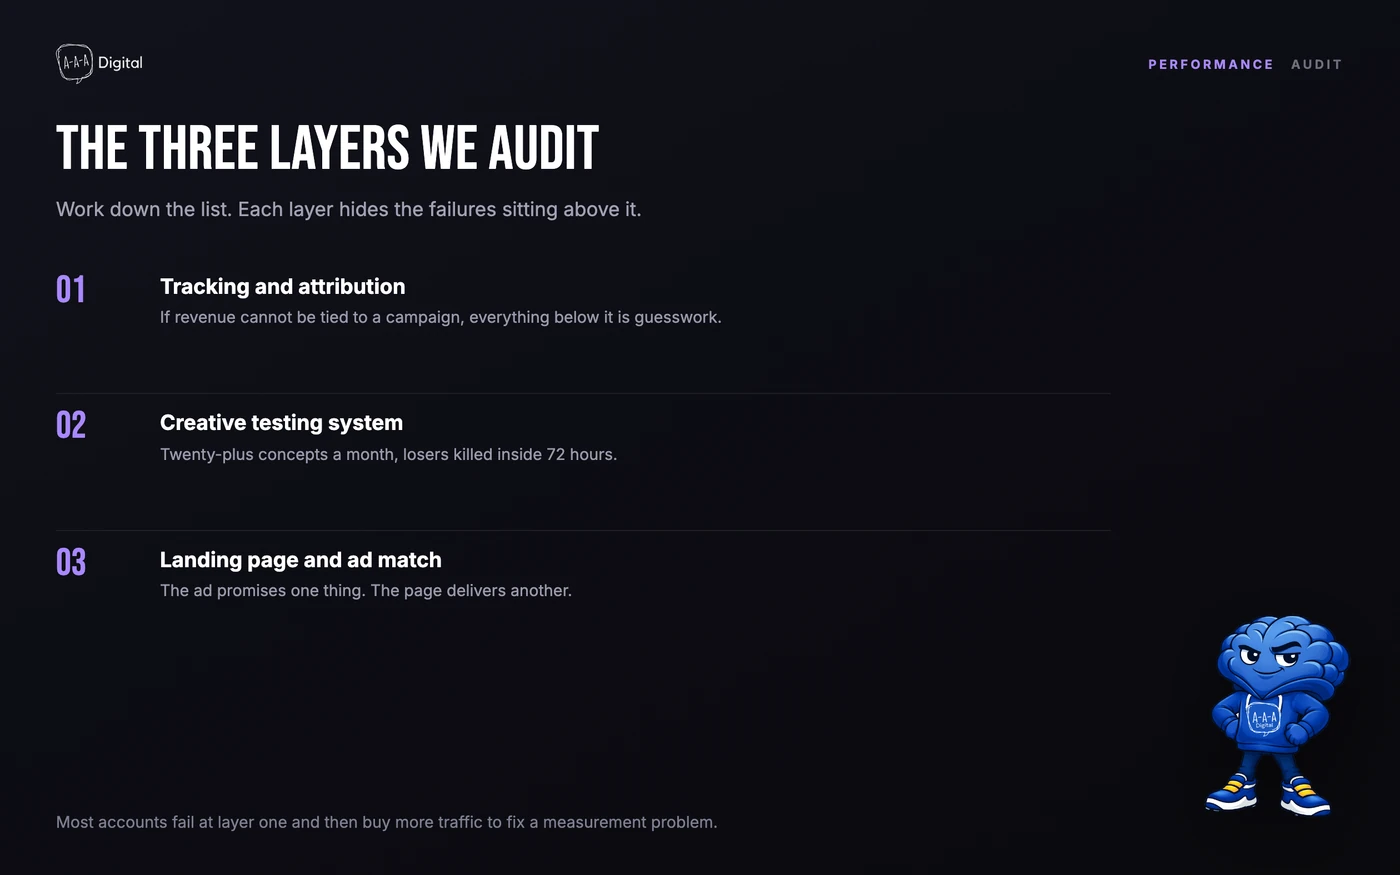
Layer 1: Tracking & Attribution
If you cannot accurately attribute revenue to campaigns, you are flying blind. Most brands lost reliable tracking after iOS 14.5 and never recovered.
Fix: Implement Conversions API (CAPI), server-side tracking, and first-party data collection. We typically recover 85 to 95% of attribution accuracy for our clients. If your spend is going up while results flatten, what Google Ads actually costs is the other half of that conversation.
Layer 2: Creative Testing System
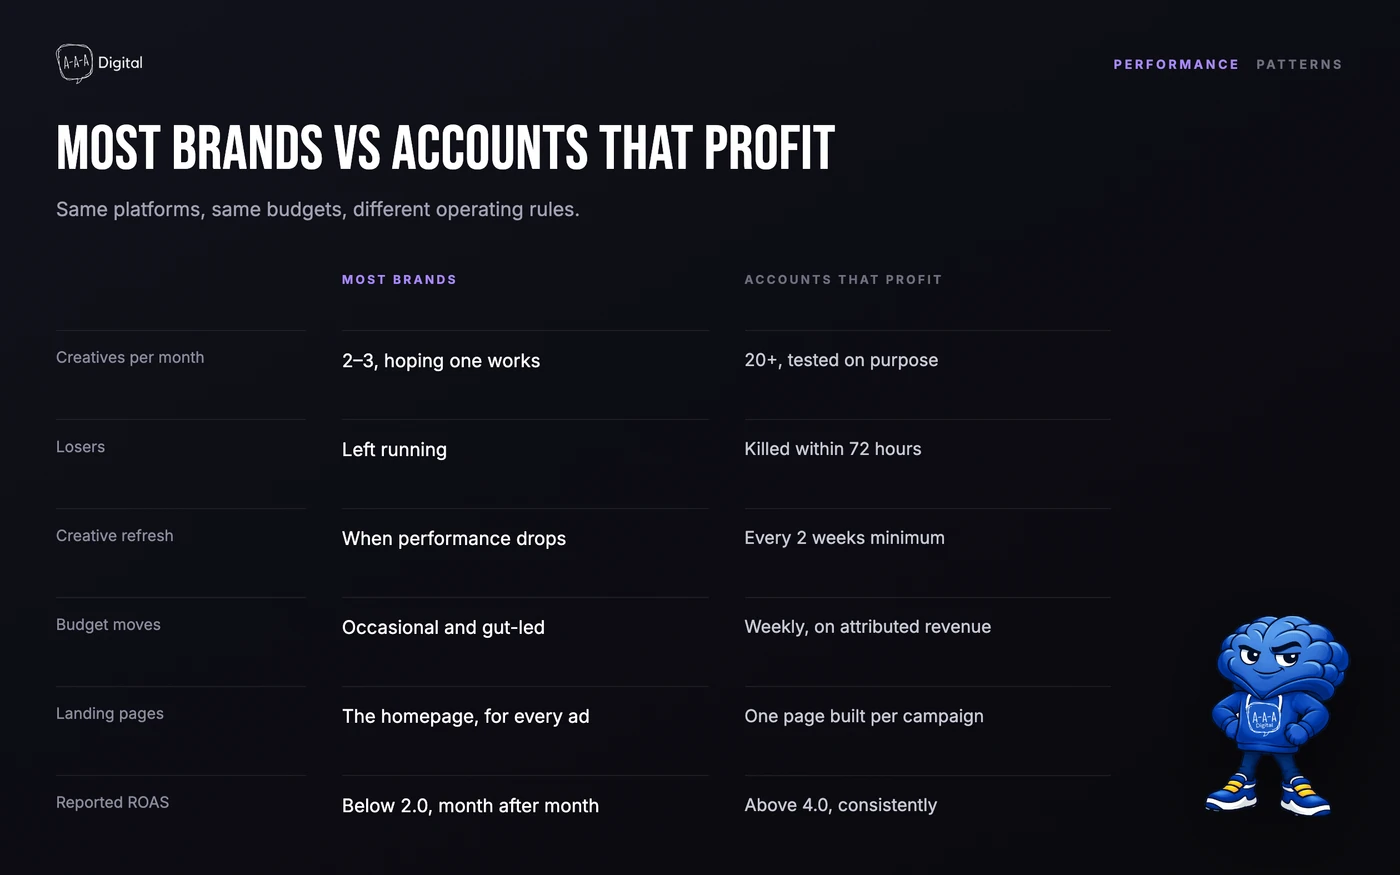
Most brands launch a few ad creatives and hope one works. We launch 20+ per month, kill losers within 72 hours, and double down on winners.
Fix: Build a systematic creative testing protocol. Test hooks, angles, formats, and CTAs at scale. Let data decide what stays, not your gut feeling.
Layer 3: Landing Page ↔ Ad Match
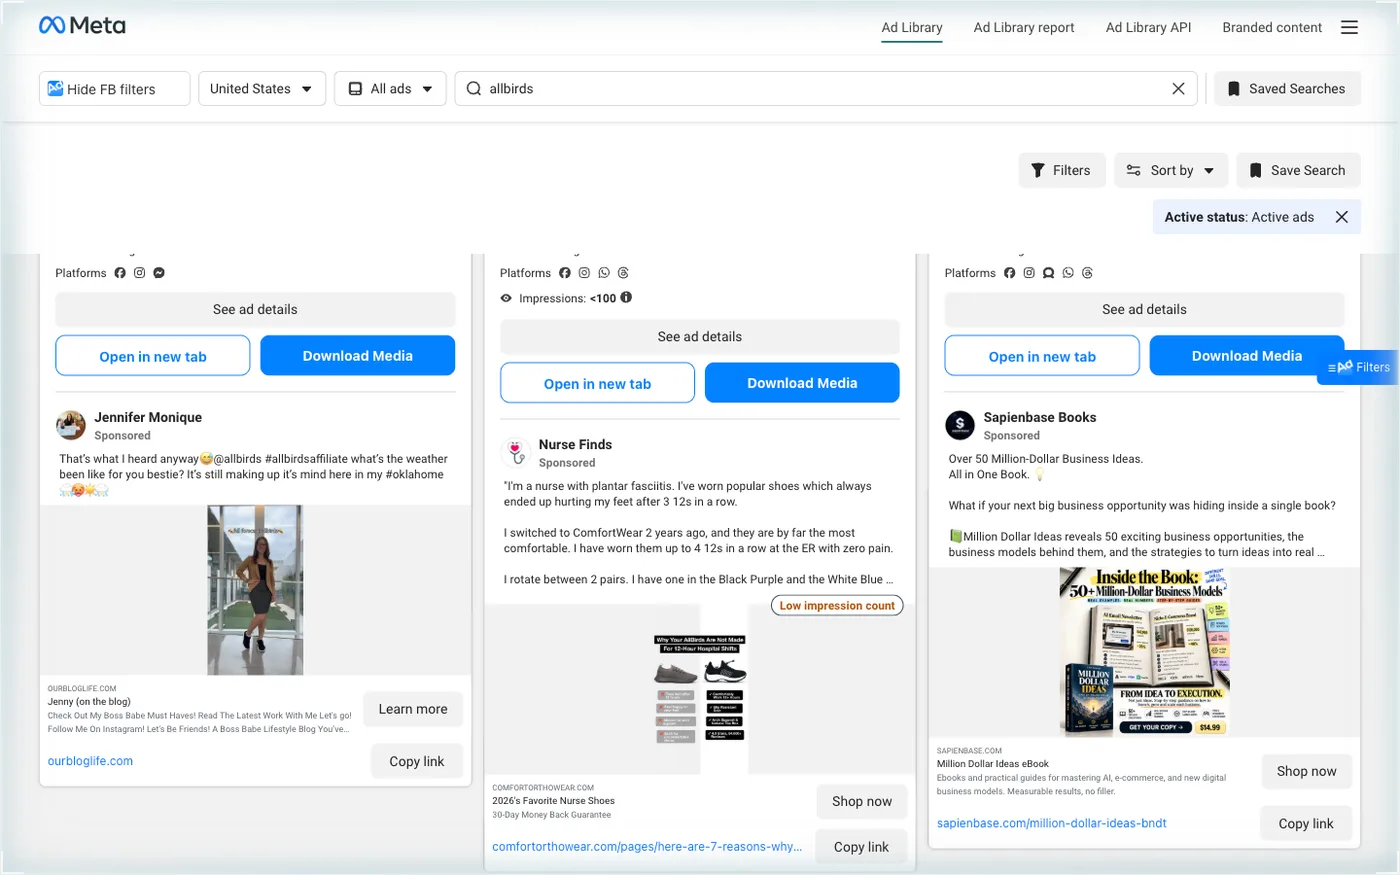
Your ad promises one thing. Your landing page delivers something else. The message mismatch kills conversion rates.
Fix: Build dedicated landing pages for each campaign. Match the headline, imagery, and offer exactly to the ad. We have seen 40%+ conversion lifts just from this.
The Maths Nobody Puts in the Pitch Deck
Before you can call a campaign a failure, you need the number it failed against. Not 3.0, or 4.0, or whatever a competitor's case study claimed. Your own contribution margin.
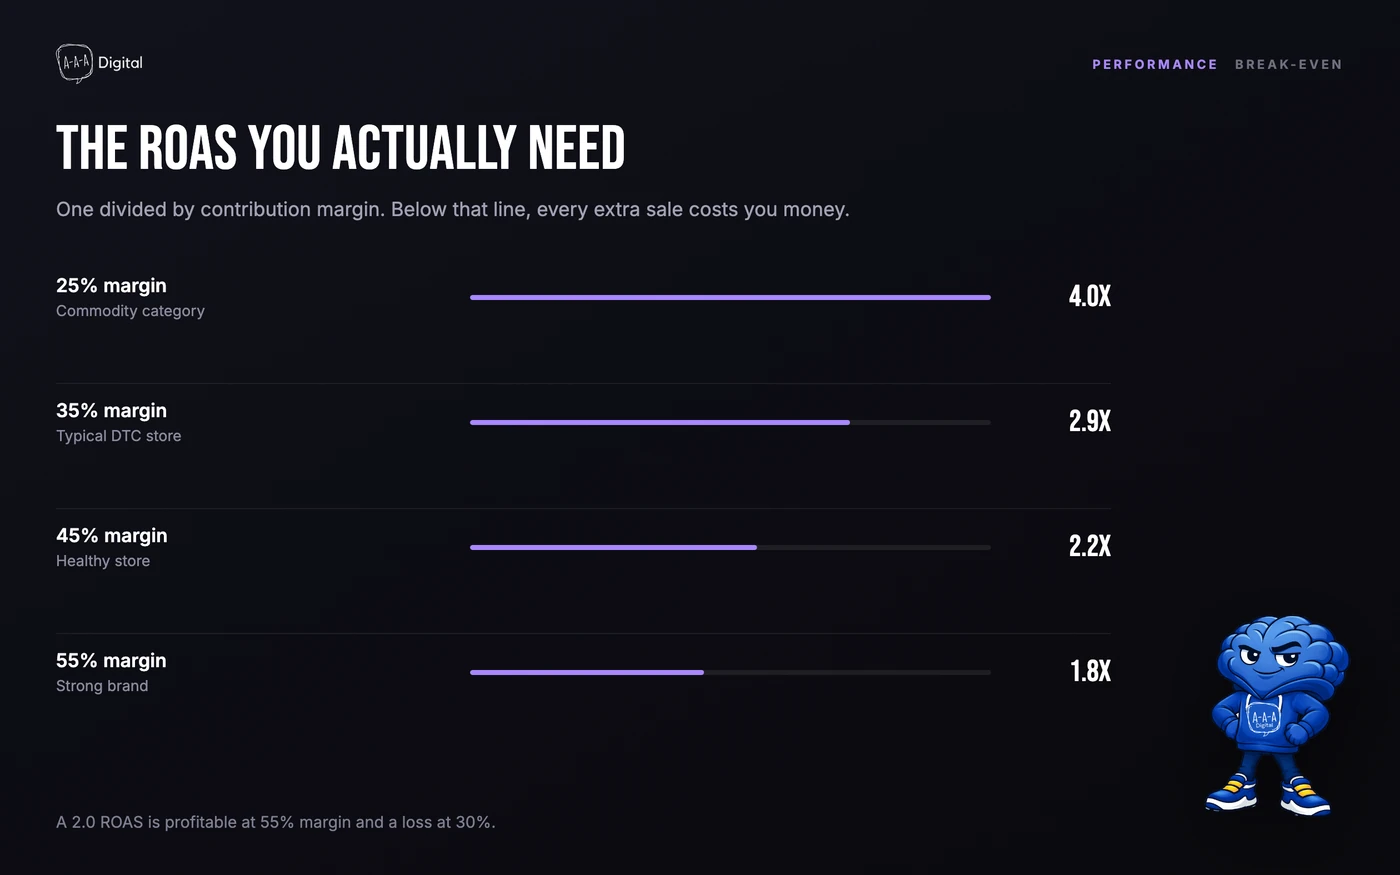
Break-even ROAS is one divided by contribution margin. Keep 45 cents of every dollar after product, shipping and card fees, and you need 2.22 to break even on the first order and nothing else.
A $60 order, worked through: product $22, shipping and fulfilment $8, card fees at 3.2% $1.92. Contribution $28.08, or 46.8%.
At a 2.0 ROAS you spend $30 to get $60 and lose $1.92 per order. At 4.0 you spend $15 and keep $13.08. Same product, same creative, same audience. One is a rounding error from bankruptcy, and the Friday PDF calls both of them "performing."
For 15 points of net margin after media, the ROAS you need is one divided by (margin minus 0.15). At 46.8%, that is 3.14.
| Contribution margin | Break-even ROAS | ROAS for 15% net margin |
|---|---|---|
| 25% | 4.0 | 10.0 |
| 35% | 2.9 | 5.0 |
| 45% | 2.2 | 3.3 |
| 55% | 1.8 | 2.5 |
| 65% | 1.5 | 2.0 |
A 25% margin brand and a 65% margin brand can run identical ads and land on opposite sides of profitable. That is why benchmark posts are useless. Your customer acquisition cost has to be measured against your contribution, not an industry average.
One number most reports leave out: MER, total revenue divided by total marketing spend. Platform 1.4 with MER 2.8 means the ads are fine and the measurement is broken. Our weekly metrics dashboard keeps both side by side.
Repeat purchases raise that ceiling by roughly their own rate. At a 30% repeat rate, you can pay about 30% more than first-order break-even and still be flat.
How to Tell a Channel Problem From a Creative Problem
Almost every agency says test more creative. Few say when creative is not the answer. This diagnostic runs the cheapest test first.
| Symptom | What it usually means | The test | The fix |
|---|---|---|---|
| CTR at or above account average, conversion rate half the site average | Page and offer, not the audience | Send the same ad to a dedicated page and to the product page | Rebuild the page to match the ad |
| CTR half the account average, conversion rate normal | Hook or format | Swap creative, keep audience and budget fixed | New hooks, same offer |
| CTR and CVR both normal, CPA above break-even | Auction cost, margin, or market | Check CPM trend and contribution margin | Price, bundle, or a new segment |
| Platform ROAS 1.4, MER 2.8 | Measurement | Reconcile 30 days of orders | CAPI, UTMs, server-side events |
| Revenue flat while spend rises 30% | Saturation | Check frequency and new-customer share | Cap, widen, or refresh creative |
The rule is one variable at a time. Change audience and creative in the same week and either could have moved the number. Hold the audience, swap the creative. Hold the creative, swap the audience. Hold both, change the page.
Sample size matters more than brands admit. Meta's learning phase exits at roughly 50 optimisation events per ad set in a week. Below that, the algorithm is guessing and so are you. If your budget buys 8 conversions a day, a 72-hour kill window is a coin flip.
What to Do in the First 30 Days
This is the sequence we run on a new account. It is deliberately boring for two weeks.
Week 1: reconcile. Pull 30 days of Shopify orders and compare them to what Meta and Google claim. We treat a gap above 15% as a tracking problem. Add UTMs, install CAPI, write down your contribution margin. Our Meta Pixel and CAPI setup guide covers the gap most installs leave open.
Week 2: cut. Pause ad sets below break-even with no new-customer contribution. Consolidate to two or three campaigns. Launch nothing. You need a clean baseline before you add variables.
Week 3: build. Six to eight concepts, three hooks each, one offer. Build one dedicated page for your highest-spend campaign. The landing page versus product page decision is where most stores get this wrong.
Week 4: set the cadence. Weekly budget moves on attributed revenue, a creative refresh every two weeks, and a written kill rule agreed in advance. Do not raise budget to "give the algorithm room" or add a fourth channel in month one. Each removes your ability to tell what worked.
The 90% Claim Is Doing More Harm Than Good
We cannot defend the number in the title. Nobody can. There is no public dataset behind it, and it gets repeated because it is memorable, not because it was measured. What we can defend is the pattern.
The report and the bank account disagree. Platform revenue runs higher than the orders in Shopify, or lower once returns and discounts are counted. Once they diverge, every downstream decision uses the wrong input.
Creative volume is too low to learn from. Two or three ads running for months is not testing, it is hoping. The winners end up being the ads that got the most spend, not the ads that deserved it.
The ad and the page were written by different people. The ad sells a problem, the page lists features, and the conversion rate takes the blame.
Fix those three and most accounts move within a quarter. Leave them and no budget, bid strategy, or new channel will help, because you are scaling a machine that measures itself wrong.
What Working Campaigns Look Like
Here is what we see in accounts that actually drive profit:
- ROAS above 4.0 consistently
- Creative refresh every 2 weeks minimum
- Weekly budget reallocation based on attributed revenue, not platform-reported metrics
- Lead follow-up inside five minutes. The lead that sits in an inbox until Monday is the most expensive one you bought, and the fix is usually automated routing and first touch, not a bigger budget
Frequently Asked Questions
Why do my ads stop working after a few weeks?
Creative fatigue, usually, not a platform change. Frequency climbs, the same people see the same ad, and CTR falls before CPA moves. If frequency is above 3 and new-customer revenue is flat, refresh the creative before you touch the budget.
Is a 2.0 ROAS always bad?
No. At a 55% contribution margin it is profitable. At 25% you need 4.0 just to break even. The number is meaningless without your own cost structure.
How long should I test a creative before killing it?
Until you have roughly 50 optimisation events, where Meta exits its learning phase. At a $40 CPA that is about $2,000 of spend. If that takes three weeks, your budget is too small to test and you should consolidate first.
Should I fire my agency or fix the account?
Check reporting first. If the agency cannot reconcile orders to your store, a new agency inherits the same problem. If the numbers reconcile and the account still loses money, the issue is creative volume, page match, or offer, and it is fixable in a month. Our performance marketing team runs that audit before recommending a spend change.
The Bottom Line
Performance marketing is not broken. The way most brands approach it is.
Stop paying for impressions. Start paying for revenue.
Want us to audit your current campaigns? Book a free strategy call and we will show you exactly where your budget is leaking.
