Most Shopify stores running Google Ads in the US spend between $1,000 and $20,000 a month, and the click that starts all of it costs roughly $0.80 to $3.00 for retail and ecommerce categories. At $1.75 a click, a $5,000 monthly budget buys about 2,850 visits from people who typed what you sell, which is either plenty or nowhere near enough depending on what happens after the click.
Published cost guides usually quote one average across every industry, then stop at media spend. That number is close to useless for planning, because a furniture brand and a skincare brand do not buy the same click, and because the media line is not the whole bill. This guide covers the stack: what a click costs, what each budget tier actually buys, the fees that sit on top, and the spend level below which the account cannot learn.
What Google Ads actually charges you for
Search and Shopping campaigns are billed per click. You are not buying impressions, and you are not buying guaranteed placement. You set a bid, Google ranks every advertiser by Ad Rank (bid, ad quality, landing page, and the expected impact of extensions), and you pay roughly the amount needed to beat the ad below you, subject to a reserve price. That is why your actual cost per click is usually lower than your maximum bid, and why improving ad quality can cut the bill without touching the bid.
Two things move your cost per click more than anything else in the account. The first is the term itself. Brand searches are cheap, often $0.10 to $0.40, because nobody else is bidding seriously on your name. Non-brand category terms are where the real money goes, and they are the only ones that bring you new customers. The second is your click-through and landing page experience, which feed Quality Score and change what you pay for the same position.
Bidding strategy changes the bill as well. Maximise clicks will spend the whole budget and buy cheap traffic. Target CPA and target ROAS spend less efficiently per click but aim at orders, and they need conversion volume to work. That constraint is the reason minimum spend exists at all, and we come back to it below.
CPC by category, and what it turns into
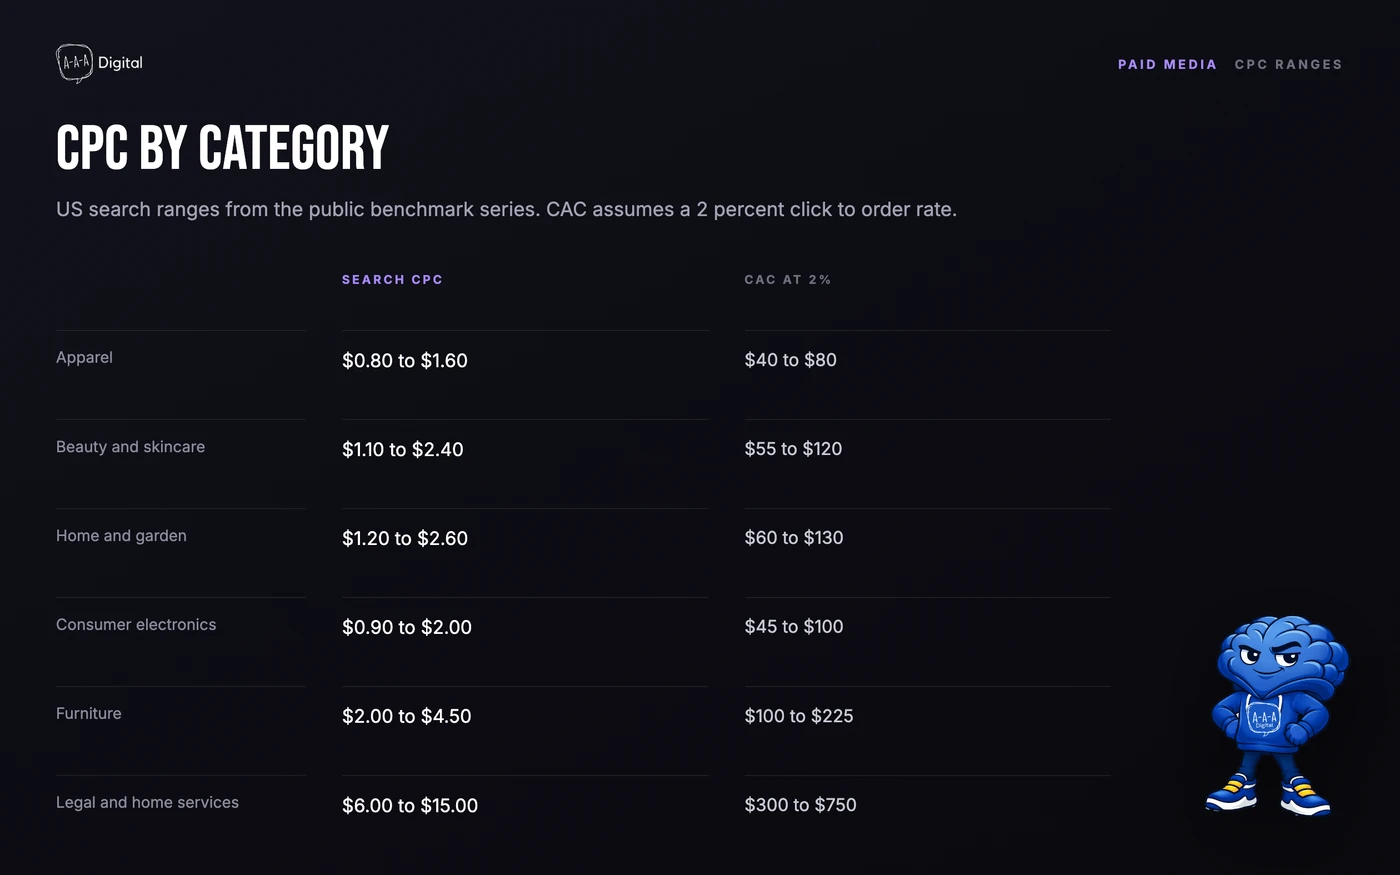
The ranges below are rounded from the public benchmark series that WordStream and LocaliQ publish each year, and they are ranges, not quotes. Your geography, match types, and product margin will move you inside or outside them.
| Category | Typical search CPC | CAC at 2% conversion |
|---|---|---|
| Apparel | $0.80 to $1.60 | $40 to $80 |
| Beauty and skincare | $1.10 to $2.40 | $55 to $120 |
| Home and garden | $1.20 to $2.60 | $60 to $130 |
| Consumer electronics | $0.90 to $2.00 | $45 to $100 |
| Furniture | $2.00 to $4.50 | $100 to $225 |
| Legal and home services | $6.00 to $15.00 | $300 to $750 |
Read the third column carefully, because it is where most budgets die. At a 2 percent conversion rate, a $1.40 click costs $70 to acquire an order. If your average order value is $80 and your gross margin is 45 percent, you have $36 of gross profit to spend and the maths does not work. Either the conversion rate has to climb, or the click has to get cheaper, or the traffic has to come from a surface with lower costs. That is the entire job, and no budget tier fixes it on its own.
Cold search traffic converting at 2 percent is a reasonable planning assumption, not a promise. Plenty of stores run at 1 to 1.5 percent on broad terms and well above 4 percent on brand and retargeting. Blending them into one number hides the part that matters.
The full cost stack
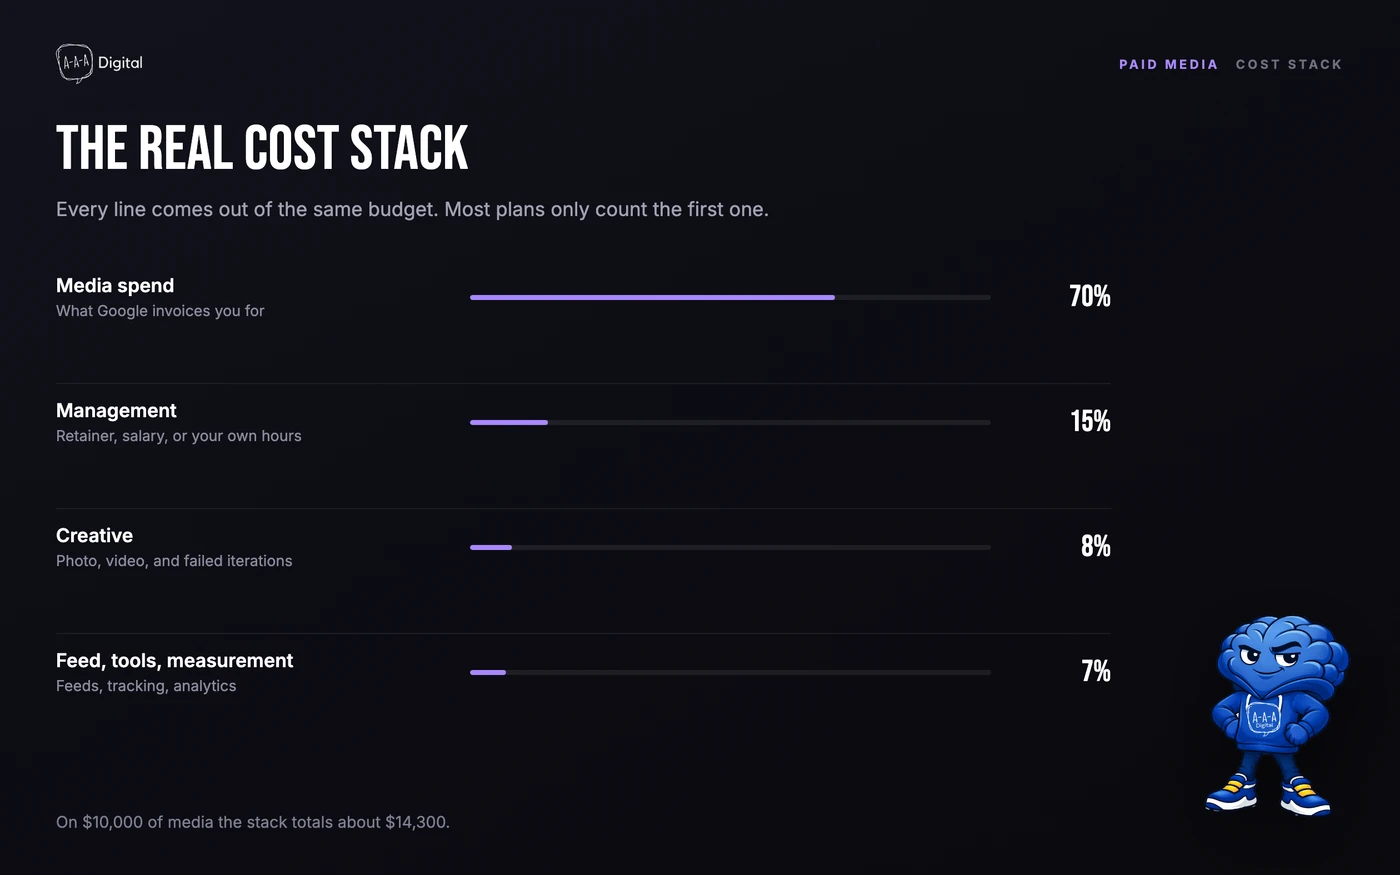
Media is about 70 percent of what a properly run account costs. The rest is the work that makes the media perform: someone managing bids and search terms, creative that gets refreshed before it fatigues, a product feed that is not full of missing GTINs, and measurement you can trust.
On $10,000 of media, a realistic total is $14,300 once you add a $2,000 management fee, $800 of creative, and $500 of feed and tracking tools. Every dollar of media costs $1.43. Stores that plan for $10,000 and spend $14,300 have a bad first quarter and blame the channel.
The mix shifts with size. A $2,000 account can spend 30 percent on management because the fee has a floor. A $50,000 account might spend 10 percent, because the same team can run more spend without more hours. Creative behaves the opposite way: a fixed production cost gets cheaper per dollar of media as the budget grows.
What $1,000, $5,000, $20,000 and $50,000 a month buys
| Monthly media | What it can support | Clicks at $1.75 | Orders at 2.5% |
|---|---|---|---|
| $1,000 | One search campaign, three ad groups, no testing | 570 | 14 |
| $5,000 | Search plus Performance Max, weekly creative tests | 2,850 | 71 |
| $20,000 | Brand, non-brand, Shopping, retargeting, feed work | 11,400 | 285 |
| $50,000 | Category defence, conquesting, YouTube, a team | 28,500 | 712 |
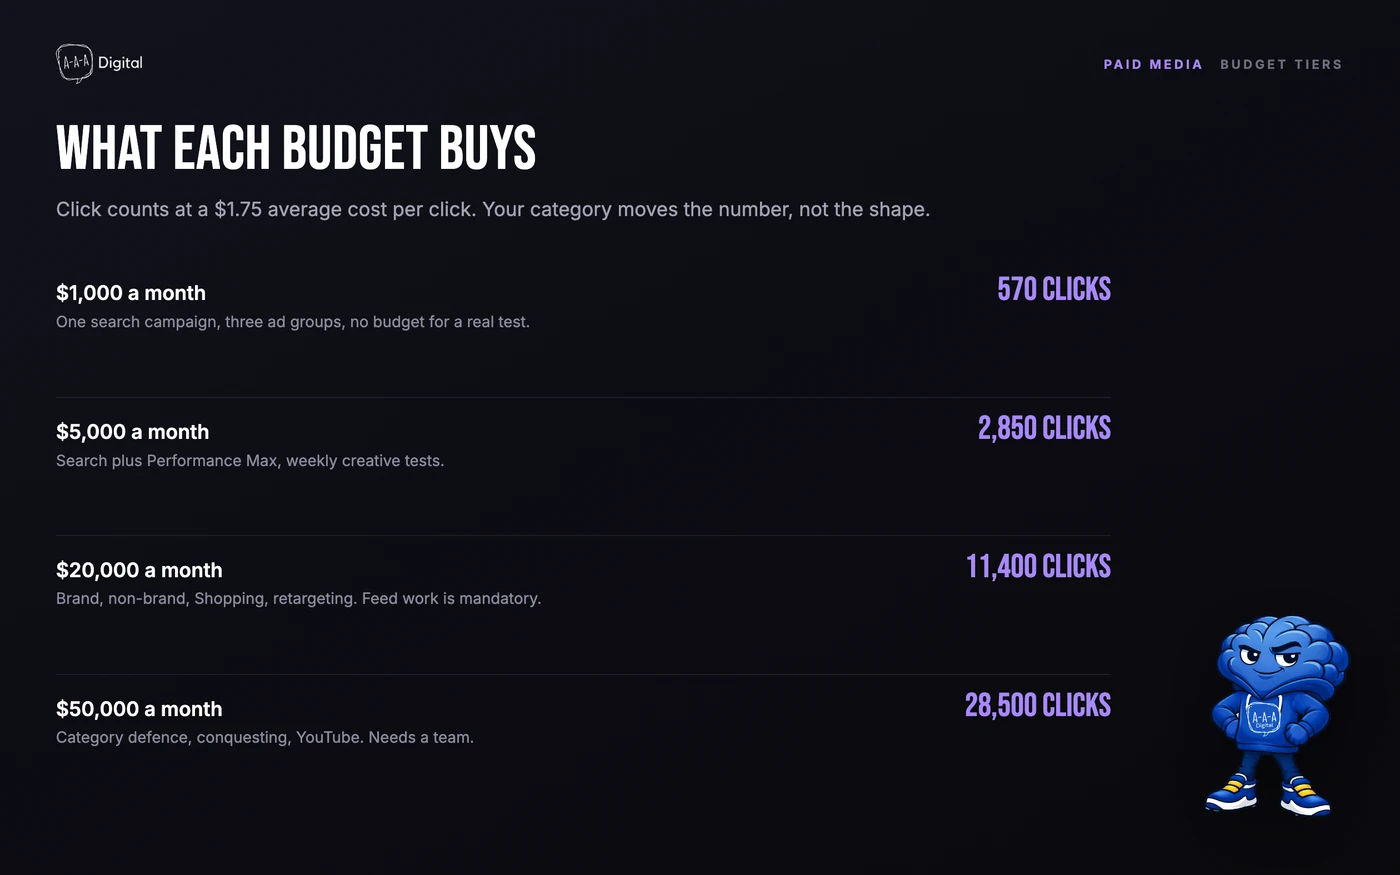
The order counts are arithmetic, not a forecast. They exist to show how thin the middle tiers are. At $5,000 a month you are buying 71 orders, which means about $70 of media per order. A store with $60 of gross profit per order loses money at that tier before it pays for anything else, and no amount of optimisation changes the arithmetic.
Here is a worked example we use in planning conversations. A home fragrance brand sells at an $85 average order value with a 50 percent gross margin, so each order carries $42.50 of gross profit before ads. The owner sets a target CAC of $32, which leaves $10.50 for overhead and profit. At a 2.5 percent conversion rate, the highest click the store can afford is $0.80 ($32 times 0.025). Its category terms clear at $1.10 to $1.40. At $1.40, the store would need a 4.4 percent conversion rate to hit the same CAC.
That store has three honest options: push conversion rate on the product page, shift more budget to Shopping and Performance Max where clicks are cheaper, or accept a lower contribution per order while it builds repeat purchase. What it cannot do is buy its way out with a bigger budget. Spending $20,000 at a $1.40 click and a 2.5 percent conversion rate produces 357 orders at $56 each, and the margin is gone.
What management costs, and when it stops making sense
Agencies and freelancers price this differently, but the market range we see in proposals is $1,000 to $3,000 a month for a single-channel small account, or 10 to 20 percent of media spend, whichever is higher. Larger accounts move toward a percentage with a cap, and enterprise accounts move to a flat retainer with a scope document.
The percentage model punishes growth. At $5,000 of spend, 15 percent is $750, which buys barely a day of senior time. At $50,000, 15 percent is $7,500, which is a full-time person. Most agencies solve that by setting a minimum fee, which is why small accounts end up paying 25 to 30 percent of media in management.
The practical rule: below $5,000 of monthly media, use a flat fee or manage it in-house, because a percentage deal will either be too small to fund real work or too large to leave margin. Between $5,000 and $30,000, a flat fee with a clear scope beats a percentage. Above that, a percentage with a cap is fair to both sides, provided the scope names what is included.
In-house is not free either. A competent paid search manager costs $70,000 to $110,000 a year in the US, plus tooling. That is $6,000 to $9,000 a month before you buy a single click, and it only makes sense once you are spending enough to keep that person busy.
Creative, feed and measurement costs
Creative is the line most budgets forget. Static product images can come from existing photography, but responsive search ads and Performance Max want video, and video costs money. A half day of studio product photography runs $400 to $1,200 in most markets we work in. Short-form UGC video runs $150 to $400 per asset, and you need a steady supply, because the best performing asset in a mature account is usually three weeks old.
Feed management is either a $20 to $100 a month app or a specialist, depending on catalogue size. Merchant Center itself is free, but a feed with missing GTINs, mismatched prices, and 40 percent disapproved variants is an expensive free tool. Budget a few hours a month for feed hygiene at minimum.
Measurement is the last line and the one that pays for itself. Call tracking runs $30 to $100 a month. Server-side tagging, if you need it, is a project rather than a subscription. Without clean conversion tracking, everything above is guesswork, which is why we treat CAC measurement as part of the setup rather than a reporting afterthought.
The minimum viable spend
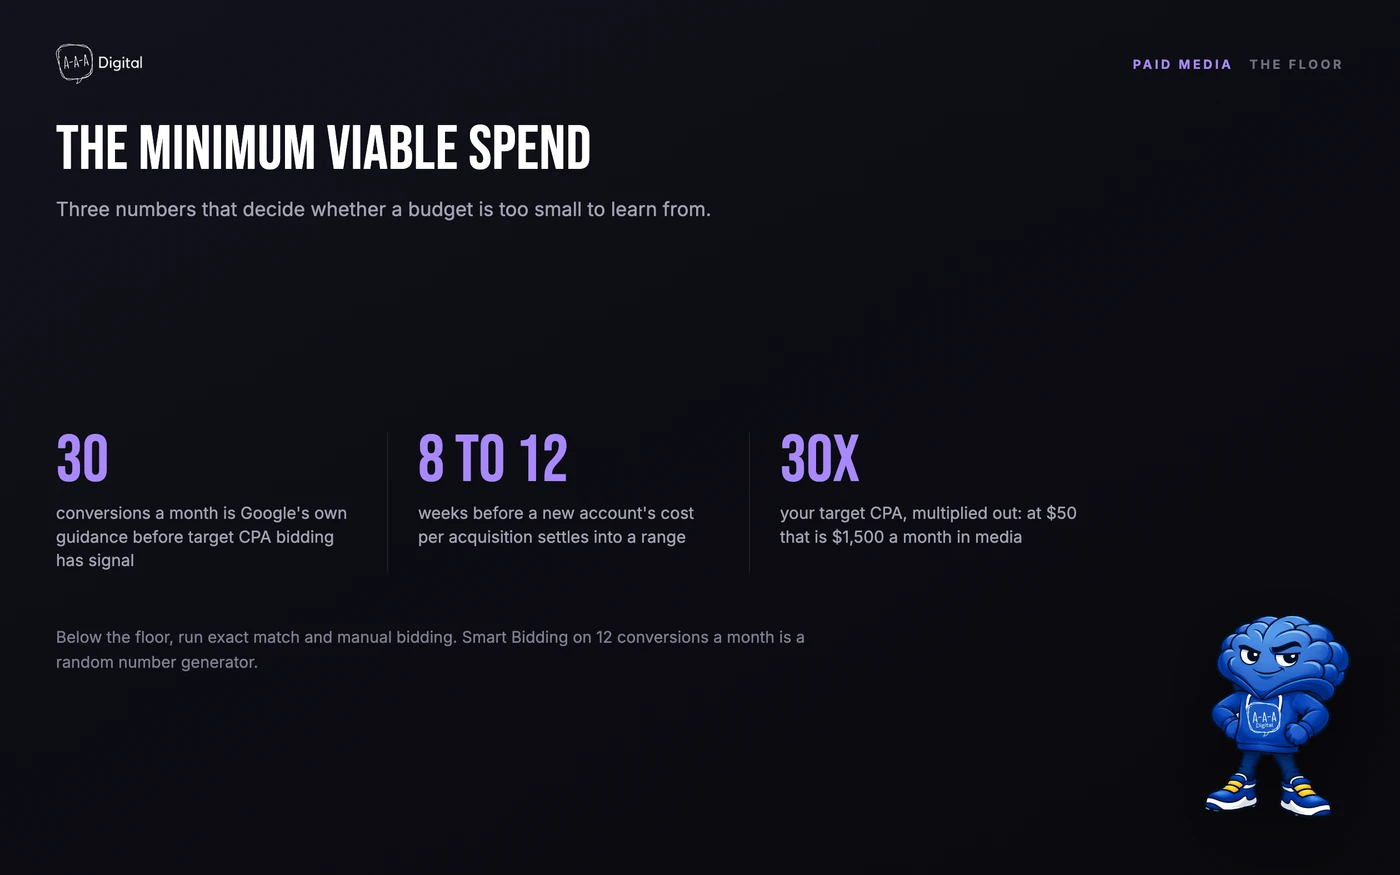
Google's own guidance for target CPA and target ROAS bidding is 30 conversions in the last 30 days. Below that, the algorithm is fitting a curve to noise, and you will see wild swings in cost per acquisition that have nothing to do with your ads.
Thirty conversions multiplied by your target CPA gives you the floor. At a $50 target, that is $1,500 a month. At a $120 target, it is $3,600. If your budget cannot reach 30 conversions, do not use smart bidding. Run exact match keywords with manual or maximise clicks bidding, keep the account small and tight, and accept that you are buying learning rather than scale.
The second number, 8 to 12 weeks, is our observation from new accounts rather than a published benchmark. Cost per acquisition starts high, drops as the account collects data, then settles into a range. Judging a campaign at week three is judging the learning phase.
Where budgets leak
Most accounts we audit are not short of budget. They are spending it in places that cannot produce incremental revenue.
| Leak | What it looks like | Typical share of spend |
|---|---|---|
| Brand terms counted as growth | You bid on your own name and report it as new revenue | 15 to 35% |
| Broad match without negatives | Search terms report full of irrelevant queries | 10 to 25% |
| Performance Max on a dirty feed | Spend spread across weak variants and out of stock items | 20 to 40% |
| Duplicate conversion actions | Two Purchase tags fire, so CPA looks half as expensive | Hard to see, easy to fix |
| Reporting on last click only | Meta and Google both claim the same order | Distorts every decision |
Those shares are ranges from our own audits, not industry benchmarks. The brand number is the one owners resist, because brand campaigns do convert and they do show a low CPA. They also take credit for demand you already created, which is why brand spend belongs in a separate budget line with its own target.
How to set a budget you can defend
Start from the order you need, not from what feels affordable. Target CAC multiplied by the number of orders you want gives the media budget. Add 35 to 45 percent for management, creative, and tools to get the real number. Then check it against gross profit: if media plus fees exceed 40 percent of revenue at your current conversion rate, the plan needs a conversion rate project before it needs a bigger budget.
Three checks before you sign anything:
- Can this budget produce 30 conversions a month? If not, plan for manual bidding and a longer ramp.
- Does the fee stay under 20 percent of media at this spend? If not, negotiate a flat fee or bring it in-house.
- Is conversion tracking verified against Shopify orders? If the numbers disagree by more than 15 percent, fix that first. Our breakdown of why performance marketing fails covers the reporting traps in detail.
None of this is exotic. It is the difference between a budget that buys clicks and one that buys orders. If you want the numbers modelled against your own margins before you commit, our performance marketing team builds the plan from your P&L, and the Shopify ROI calculator will tell you what a given spend has to return to be worth doing. For the reporting side once campaigns are live, the DTC metrics dashboard shows which numbers to watch weekly, and A/B testing the landing page is usually cheaper than raising the bid.
