I have watched a fashion account burn ₹40 lakh in a single quarter on campaigns that Ads Manager graded at 3x ROAS. Nobody on that team was bad at their job. The targeting was fine, the creative was fine. The problem was that nobody had costed the orders that came back. With cash on delivery running above 55% and roughly one in four shipments returning to the warehouse, the account was celebrating platform numbers while the P&L quietly bled. COD still accounts for roughly half of Indian ecommerce orders, and every COD parcel is one the customer can refuse for free at the doorstep.
That gap is the subject of this post. India is not a market where you can read ROAS off a dashboard and call it a day. COD still dominates first orders, return-to-origin (RTO) rates run several times what a US or UK brand would tolerate, and the economics only work if you do the math per delivered order, not per shipped order. In the D2C benchmarks report we publish at AAA Digital, RTO is the single line that decides whether a category is a business or a bonfire. This post is the math underneath those numbers: true CAC after RTO, the break-even ROAS for Indian D2C margins, and the levers that actually move both. Everything below comes from live accounts we manage and the category data in that report, not from theory.
The Number Meta Will Never Show You
Ad platforms report CPP, cost per purchase. What they cannot see is what happens after the purchase, because delivery, refusal, and reverse logistics all happen outside the pixel. In a COD-heavy market, that blind spot is enormous. CPP is a shipped-order number: the pixel fires at purchase, long before anyone knows whether the parcel gets accepted, refused, or abandoned at the doorstep.
The formula we run on every D2C account we manage:
True CAC = CPP ÷ (1 - RTO%)
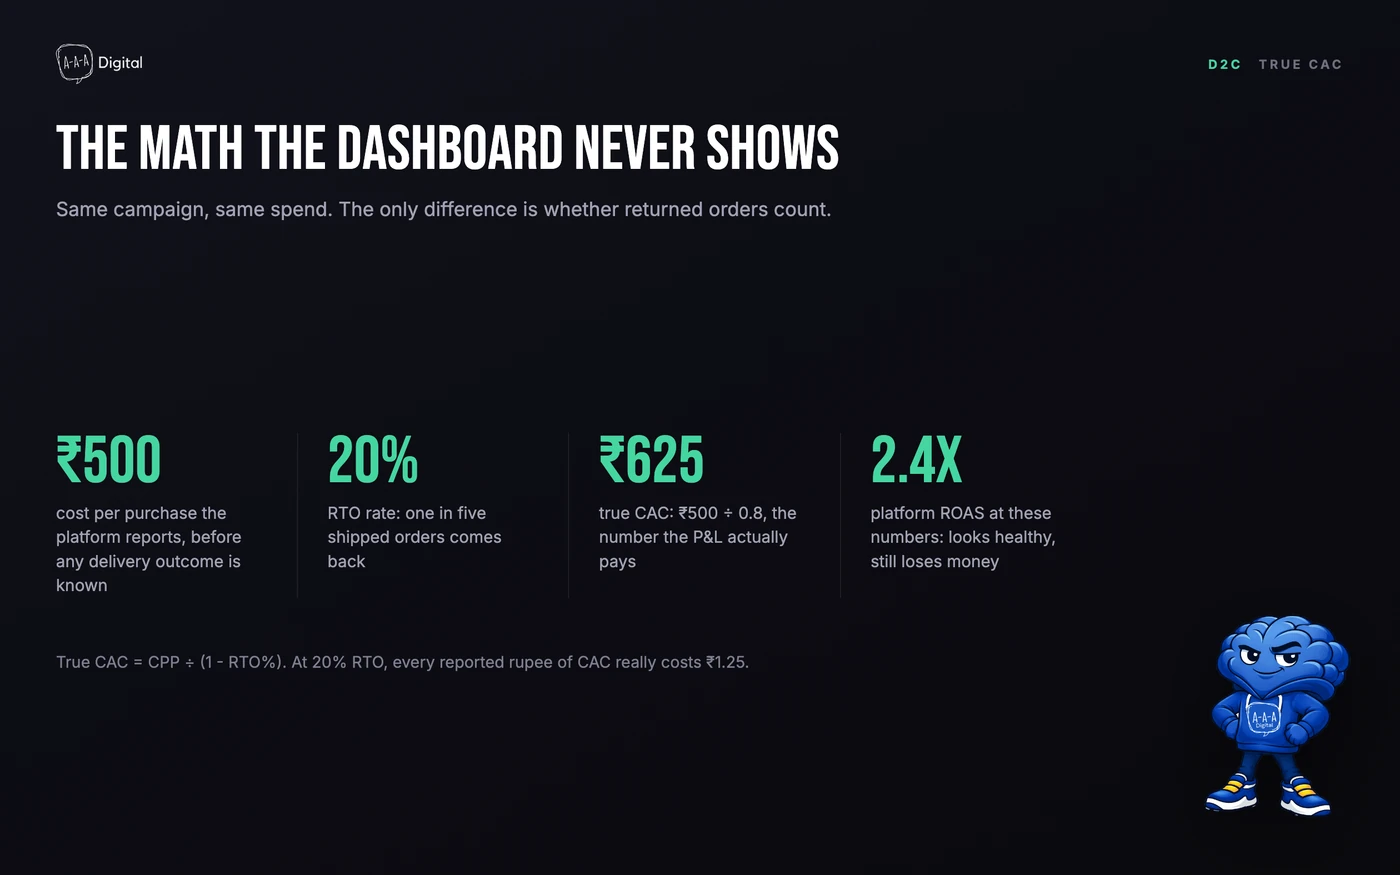
Take a typical account: CPP of ₹500 and RTO of 20%. The dashboard says acquiring a customer costs ₹500. In reality, for every 100 orders the brand pays to acquire, only 80 stay delivered, and the ad platform bills you for all 100. So the true CAC is ₹500 ÷ 0.8 = ₹625. Same spend, same campaigns, 25% higher acquisition cost than anyone inside the company believed. That ₹625 is the number your bank account pays, so it is the number every scaling decision should be measured against.
Push RTO to 30%, which is simply a soft month in women's ethnic wear, and the same ₹500 CPP becomes ₹714. At 35%, it is ₹769. This is why two brands with identical ad accounts can have opposite P&Ls. The difference is not media buying. It is what happens at the customer's door.
Blended CAC across Indian D2C categories runs roughly ₹300-2,500 depending on what you sell, with fashion typically ₹280-₹520 per delivered customer. Those ranges only make sense once RTO is inside the number. A category running 10% RTO and a category running 30% RTO are not playing the same game at the same CPP, and no bidding strategy closes that gap. Within fashion alone, women's ethnic wear runs CPPs of ₹280-620 while innerwear and sustainable lines push past ₹1,000, so two fashion brands can quote the same ROAS and report opposite months. We broke down the fully-loaded version of this math, fees, creative, and discounts included, in our customer acquisition cost guide. Read it alongside this one.
One Order, Fully Costed
Here is the worked example I walk every new client through. A women's ethnic wear order, costed per delivered unit, before and after the RTO levers from later in this post. The figures are a composite of accounts we run in this category; yours will differ, the shape will not. Women's ethnic is the example for a reason: it has the widest gap between handsome platform ROAS and brutal delivered economics, so if the math holds here, your category is rarely harder.
Order economics: ₹1,200 AOV, ₹500 CPP
| Line item | Today: 20% RTO, COD-heavy | After levers: 10% RTO, prepaid-heavy |
|---|---|---|
| AOV | ₹1,200 | ₹1,200 |
| COGS (40% of AOV) | -₹480 | -₹480 |
| Shipping + COD handling | -₹113 | -₹100 |
| Reverse logistics (RTO drag) | -₹40 | -₹18 |
| True CAC (₹500 CPP ÷ delivered share) | -₹625 | -₹556 |
| Contribution per delivered order | -₹58 | +₹46 |
Here is the same account viewed per 100 shipped orders, which is how I actually audit it. Ad spend is ₹50,000, one hundred times the ₹500 CPP. Eighty orders stay delivered and produce ₹96,000 of revenue at a ₹1,200 AOV. COGS at 40% takes ₹38,400, forward shipping and COD handling take ₹9,000, and the twenty returned orders cost roughly ₹3,200 in reverse pickup and repackaging. Net result: -₹4,600 per hundred shipments, or -₹58 on every delivered order. No single line item looks fatal. Together they outvote the AOV. Notice also what did not move: ad spend stayed flat at ₹50,000. Every rupee of improvement in this post comes from delivery outcomes, not from bidding.
Look at the platform's view of this order: ₹1,200 of revenue on ₹500 of ad spend is 2.4x ROAS, a number most media buyers would screenshot and send to the client. On 40-50% gross margins, break-even platform ROAS is roughly 2.0x-2.5x before shipping and RTO costs, which means this "healthy" 2.4x was already underwater the moment the first courier label printed. The dashboard optimizes for orders; the business lives or dies on delivered orders. The full cost picture above is what margin improvement work actually looks like: not a pricing debate, but a line-item audit.
Now look at the right-hand column. Same AOV, same creative, same products. RTO at 10% instead of 20% cuts true CAC from ₹625 to ₹556, trims the RTO drag from ₹40 to ₹18, and moves COD handling down with a higher prepaid share. Contribution flips from -₹58 to +₹46. That ₹104 swing per order is the entire argument of this post. You do not need more traffic. You need fewer returned orders.
Purists will notice the table leaves out gateway fees, packaging, and GST on ad invoices, which makes -₹58 the optimistic read. The levers below do not depend on those decimals: RTO drag and CAC inflation move by hundreds of rupees per order, and that is where the repair work goes.
Why RTO Hits Some Categories Harder
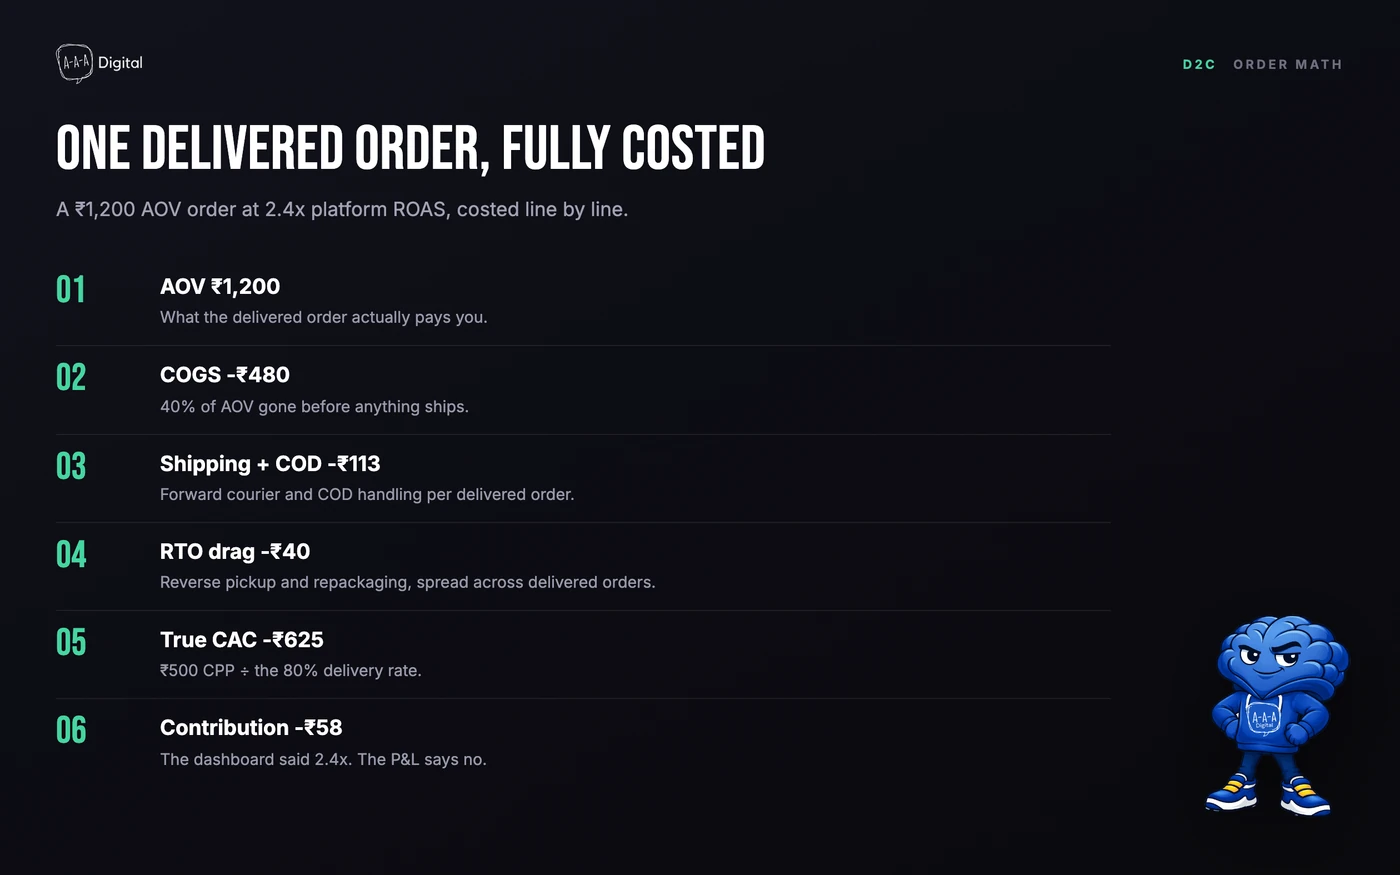
RTO is not evenly distributed, and the pattern tells you what causes it. Fashion and apparel runs 20-30% RTO, with women's ethnic wear (kurtis, sarees) at 25-35% and COD share of 55-65%. Electronics sits at 8-14%, because a considered purchase with a researched product gets refused far less often. Jewelry and accessories sits at 18-26% and baby and kids at 16-24%, both pulled up by gifting orders where the buyer and the recipient are different people. Beauty and personal care lands at 14-20%, right in the middle.
The common thread is commitment. A prepaid customer has paid and is waiting for a package. A COD customer can refuse at the doorstep for free: wrong size, changed mind, a spouse who disapproves, or a delivery attempt when nobody is home. In Tier 2 and Tier 3 cities, where COD share is highest, the first order is often a trust test of the brand, not a purchase decision. Marketplaces absorbed doorstep refusals for years through courier scale; a standalone Shopify brand has no such cushion.
COD share tracks the same pattern as RTO, almost line for line. Fashion runs 50-60% COD, women's ethnic wear runs 55-65%, beauty and personal care runs 38-48%, and electronics runs 35-45%. Every COD order carries a free refusal option, so the higher the COD share, the more of your ad spend is financing round trips. Fashion's problem is not that customers dislike the clothes. It is that ordering three sizes and refusing two of them at the door costs the customer nothing, while it costs the brand a full acquisition cycle each time.
I had a women's ethnic client sitting at 31% RTO two years ago. The founder was convinced the couriers were the problem. When we traced the returns, most refused orders were first-time COD buyers in pincodes with thin delivery history, and the courier invoice had quietly become a second ad budget that nobody was managing. Fixing the economics meant fixing the order flow, not switching carriers, and RTO settled under 20% within two months of the changes below.
There is also a traffic-side mistake that makes all of this worse. Hindi and regional-language creative outperforms English by 20-30% on CPC in Tier 2 and Tier 3 cities, so brands pour budget into cheap clicks in exactly the geographies with the highest refusal rates, then act surprised when RTO climbs. The discount on clicks is real and worth taking; it just has to be paired with verification, or you are buying cheaper refusals. Cheap traffic is only cheap if the orders deliver. The category-by-category ranges, platform splits, and subcategory CPPs sit in our D2C ROAS benchmarks for India, which is the companion read to this post.
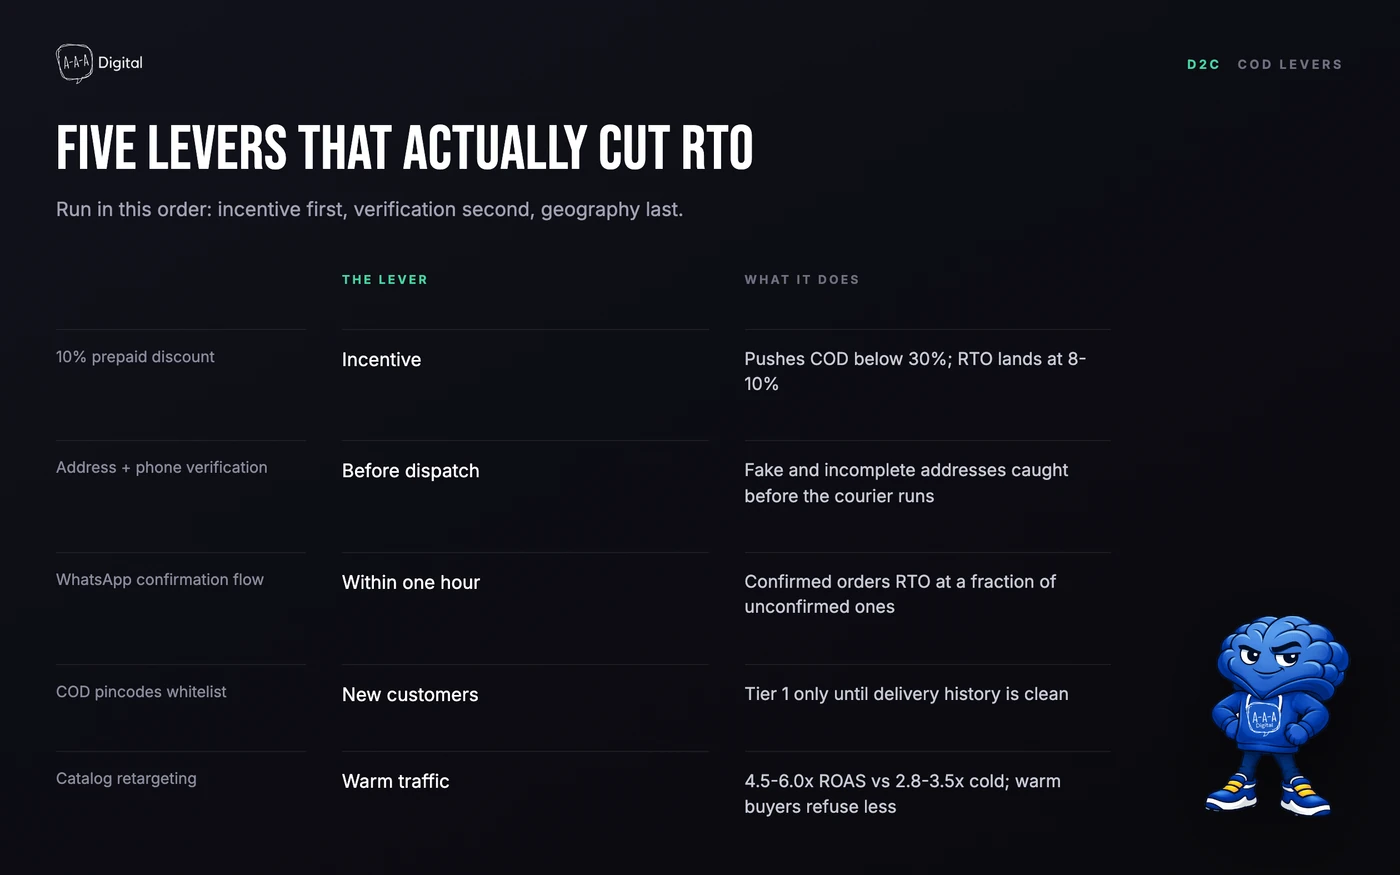
The Five Levers That Actually Move the Number
Ordered by what to implement first.
1. Prepaid incentives. A 10% prepaid discount is the single highest-impact move in the report. Where it has been applied, COD share drops below 30% and RTO lands at 8-10%. I moved a beauty account onto a 10% prepaid incentive last year, and within two months COD was under 30% and RTO had settled at 8-10%. The ₹120 discount looks expensive until you stack it against the ₹69 of CAC inflation and ₹22 of return drag it removes, before counting faster cash cycles and an emptier returns warehouse.
2. Address and phone verification. Run AI-based COD verification, a confirmation call or message before dispatch, on every COD order above your AOV median. Incomplete or fake addresses get caught before the courier burns a round trip. For new customers, limit COD to Tier 1 pincodes only. It feels aggressive; it is cheaper than ₹160 of reverse logistics on an order that was never going to be accepted.
3. WhatsApp confirmation flows. Confirm every COD order on WhatsApp within the hour and use the same thread to offer the prepaid incentive. Orders that confirm deliver at a fraction of the rate of orders nobody answers. This is the cheapest RTO reduction available to a Shopify store and most brands still do not run it.
4. Catalog retargeting. In fashion, catalog retargeting via Meta dynamic ads delivers 4.5-6.0x ROAS against 2.8-3.5x for cold prospecting, in a 30-day window with model videos rather than flat lays. Warm buyers refuse less because they have already chosen the product twice: once in the ad, once on the site. Every order shifted from cold COD prospecting to warm retargeting is more likely to stay delivered.
5. Gate the scaling behind break-even, not vibes. Every lever above only matters if the account knows its true break-even ROAS and enforces it per campaign. That is the cadence our performance marketing team runs on Indian D2C accounts: weekly true-CAC recalcs, RTO tracked by cohort and pincode, budgets moved toward whatever is holding contribution positive.
When to Scale Anyway
Festivals break every rule above in the good direction. CPMs spike 40-60% in festival windows, but conversion intent spikes harder: 2-3x ROAS. Ethnic wear CPMs climb around 60% during wedding season while ROAS hits 5-7x, and the October-to-January wedding stretch delivers roughly 2.5x volume.
I have told more than one client to underspend in February and overspend in October. The brands that scale hardest in festival season treat break-even ROAS as a hard gate all year; never let festival volume push you into shipping marginal COD orders to unverified pincodes, because scale without verification is just faster RTO.
FAQ
What is a good ROAS for D2C in India?
Across the twelve categories we track, platform ROAS runs from about 1.8x to 6.5x, so "good" only makes sense against your own break-even: roughly 2.0x-2.5x on 40-50% margins before shipping and RTO, closer to 3x once those are counted. Below the category range, fix creative; above it, scale before CPMs catch up.
How do I reduce RTO on COD orders?
In order: a 10% prepaid discount, which takes RTO to 8-10% where applied; address and phone verification before dispatch; a WhatsApp confirmation flow within an hour; and COD restricted to Tier 1 pincodes for new customers. Most accounts we manage see RTO fall by a third or more in the first month without losing volume.
What is the difference between CAC and true CAC?
Platform CAC is ad spend divided by purchases the pixel sees; true CAC divides by delivered orders: CPP ÷ (1 - RTO%). At 20% RTO, a ₹500 CPP is really ₹625 per delivered customer, and that is the number to scale against.
Is COD worth offering in India at all?
Yes: most categories see 35-65% COD share, and removing it outright removes the volume too. The move is shrinking COD's share and risk with prepaid incentives, verification, confirmation flows, and pincodes: treat it as a channel with a cost, because it has one.
Get Help With This
If your dashboard says 3x and your bank account disagrees, the gap is unit economics, not media buying. The D2C benchmarks report has platform splits, CPP ranges, and RTO baselines for twelve categories, free. Talk to our performance marketing team about running the true-CAC math on your account; most brands we audit find ₹100-200 of hidden cost per order in the first week.
