Every week a fashion founder opens our D2C benchmarks report, finds the Fashion & Apparel row, sees Meta ROAS of 2.8-4.2x, and asks the same question: is my 3.1x good or bad? The honest answer is that the category row is close to meaningless for fashion. This is the one category where the average is really two different businesses sitting inside the same ad account: a retargeting engine printing 4.5-6.0x on catalog ads, and a cold prospecting machine that often loses money after returns.
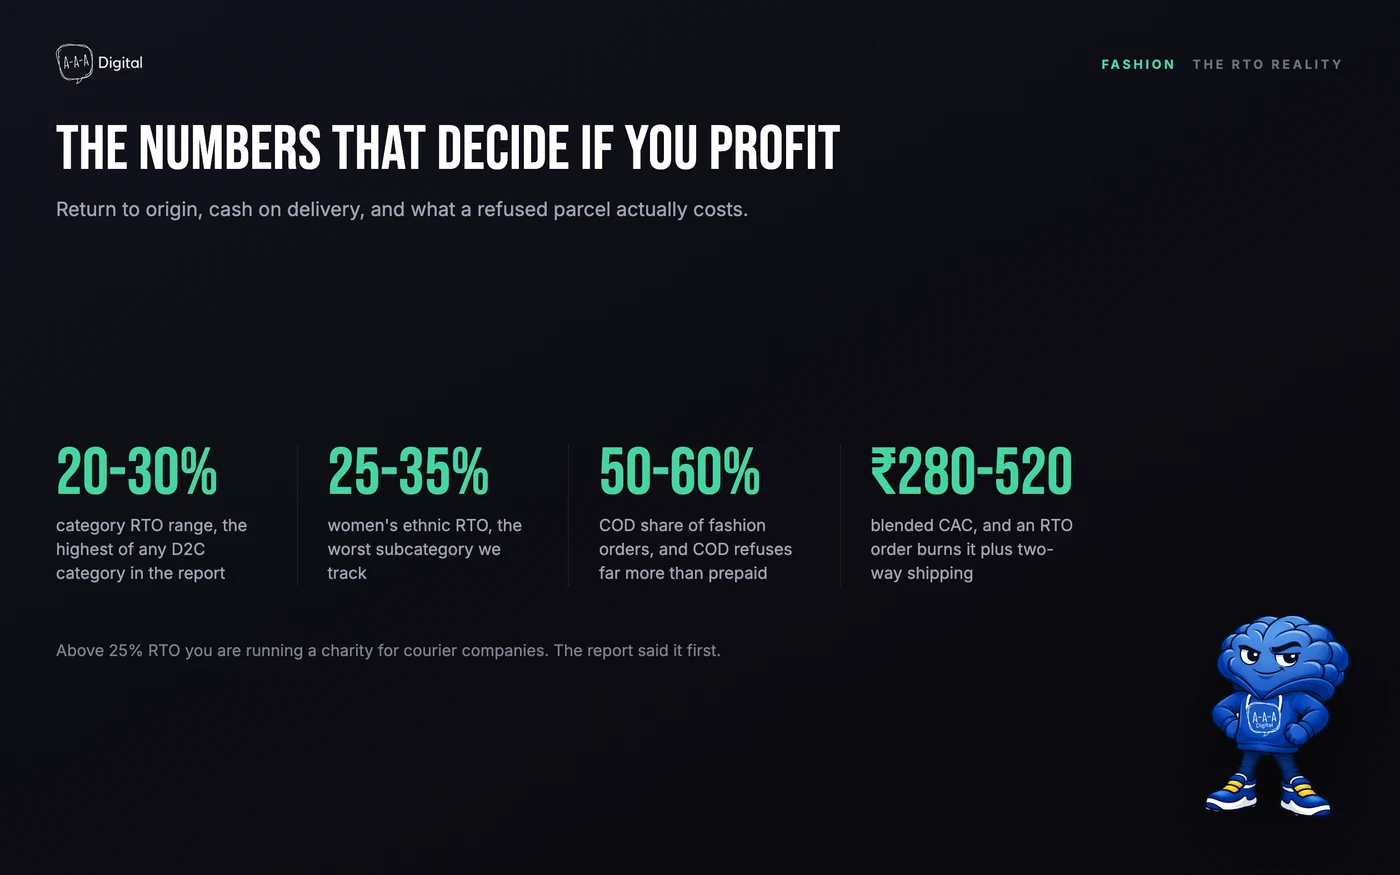
Fashion and apparel is India's largest D2C segment by volume, and it has the hardest economics of the twelve categories we benchmark. The highest COD share, at 50-60% of orders. The highest RTO, at 20-30% of shipped orders, with women's ethnic wear touching 35%. A blended CAC of ₹280-520 sitting against average order values that are often under ₹1,000.
The fashion accounts I run live or die on RTO, not on ROAS. A weak CTR you can fix with a better hook. You cannot discount your way out of a third of your orders coming back on the delivery boy's bike. This post is the operator's read of the category: the full subcategory table, where ROAS actually comes from, why ethnic wear breaks the unit economics, and the operational playbook that keeps fashion margins alive. The numbers come from our 2026 D2C benchmarks report, built from fashion accounts we manage plus category data across the Indian market.
The Full Subcategory Table, and What It Hides
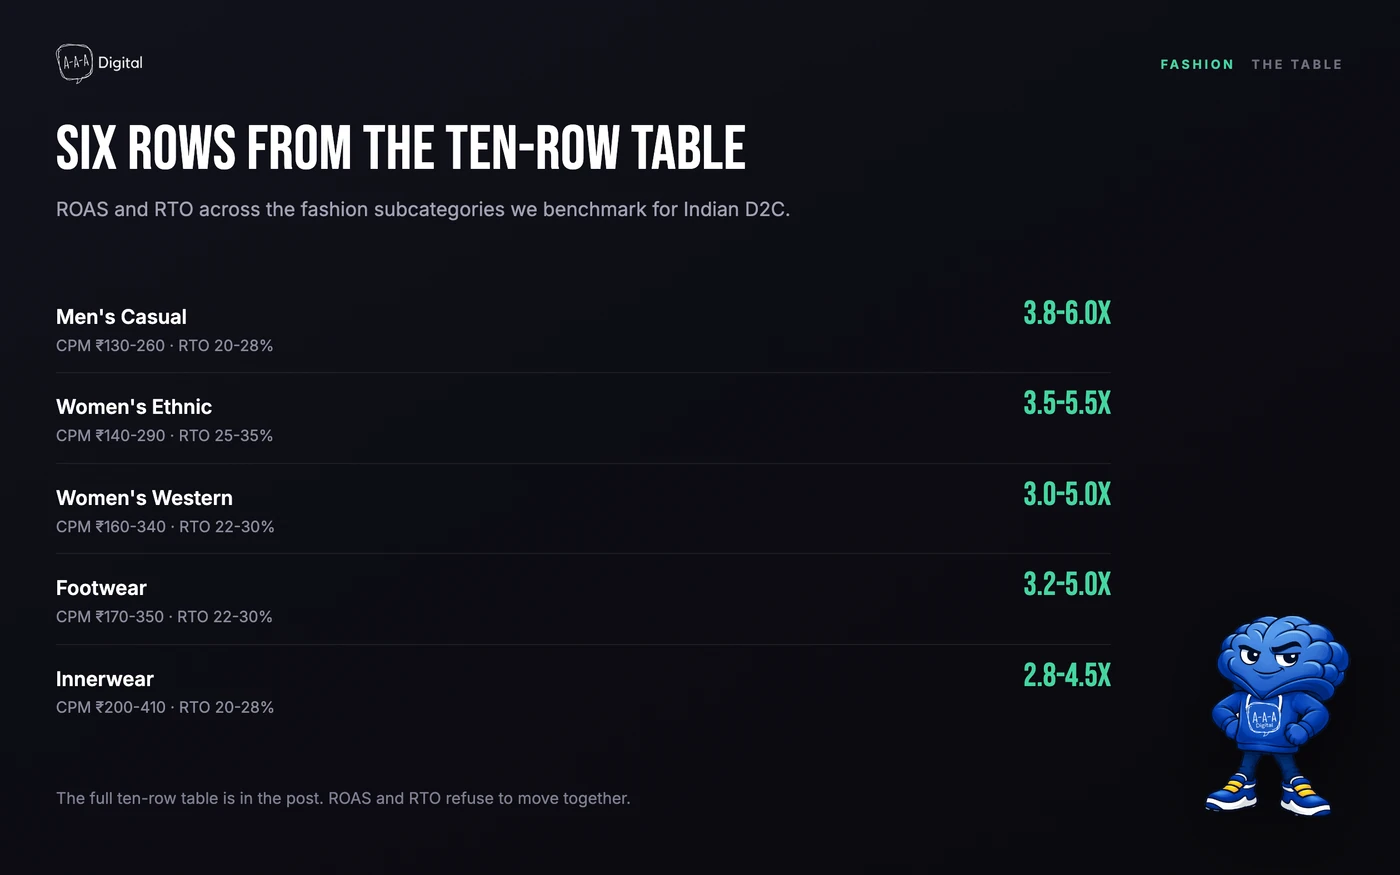
Here is the fashion table from the report, all ten subcategories, before we interpret a single number:
| Subcategory | CPM | CTR | CPC | CPP | ROAS | COD% | RTO% |
|---|---|---|---|---|---|---|---|
| Women's Ethnic (Kurtis, Sarees) | ₹140-290 | 2.0-3.2% | ₹9-20 | ₹280-620 | 3.5-5.5x | 55-65% | 25-35% |
| Women's Western (Dresses, Tops) | ₹160-340 | 2.2-3.5% | ₹10-20 | ₹320-720 | 3.0-5.0x | 50-60% | 22-30% |
| Men's Casual (T-shirts, Jeans) | ₹130-260 | 1.6-2.6% | ₹8-20 | ₹250-580 | 3.8-6.0x | 50-60% | 20-28% |
| Men's Formal (Shirts, Trousers) | ₹150-310 | 1.4-2.2% | ₹10-20 | ₹350-780 | 3.2-5.0x | 48-58% | 18-26% |
| Activewear / Athleisure | ₹180-360 | 1.8-2.8% | ₹12-30 | ₹400-900 | 3.0-4.8x | 45-55% | 18-25% |
| Innerwear & Lingerie | ₹200-410 | 1.5-2.5% | ₹14-30 | ₹500-1080 | 2.8-4.5x | 45-55% | 20-28% |
| Footwear (Sneakers, Ethnic) | ₹170-350 | 1.6-2.6% | ₹11-20 | ₹380-840 | 3.2-5.0x | 50-60% | 22-30% |
| Accessories (Bags, Belts) | ₹140-290 | 1.8-2.9% | ₹9-20 | ₹300-660 | 3.5-5.5x | 48-58% | 18-26% |
| Sustainable / Slow Fashion | ₹190-380 | 1.7-2.8% | ₹13-30 | ₹450-1020 | 3.0-4.8x | 42-52% | 16-24% |
| Plus-size / Inclusive Fashion | ₹160-340 | 2.0-3.2% | ₹10-20 | ₹320-720 | 3.2-5.2x | 50-60% | 22-30% |
Three things jump out if you read the table the way a media buyer does.
Men's casual is the best cold-traffic subcategory. CPMs of ₹130-260, the cheapest in the table, ROAS of 3.8-6.0x, and RTO of 20-28%, which is the lowest band outside formal wear and sustainable. Standardized sizing does a lot of the work here. A size 40 jean is a size 40 jean, so what the ad promises and what the box contains are usually the same thing.
Women's ethnic shows the highest ROAS and the highest RTO in the same row. 3.5-5.5x looks like the best number in the table until you see the 25-35% RTO sitting next to it. A kurti that sells for ₹799 with a ₹380-620 cost per purchase and a 30% chance of coming back is a very different business from the same kurti at 10% RTO. More on this below, because ethnic wear is where fashion economics go to die.
Innerwear has the worst acquisition economics. CPMs of ₹200-410 and CPP of ₹500-1080, against ROAS of 2.8-4.5x. Fit anxiety is highest here, customers rarely buy one unit, and returns are awkward enough that some of it never comes back at all, which quietly inflates the apparent numbers.
Where ROAS Actually Comes From: Catalog Retargeting vs Cold Prospecting
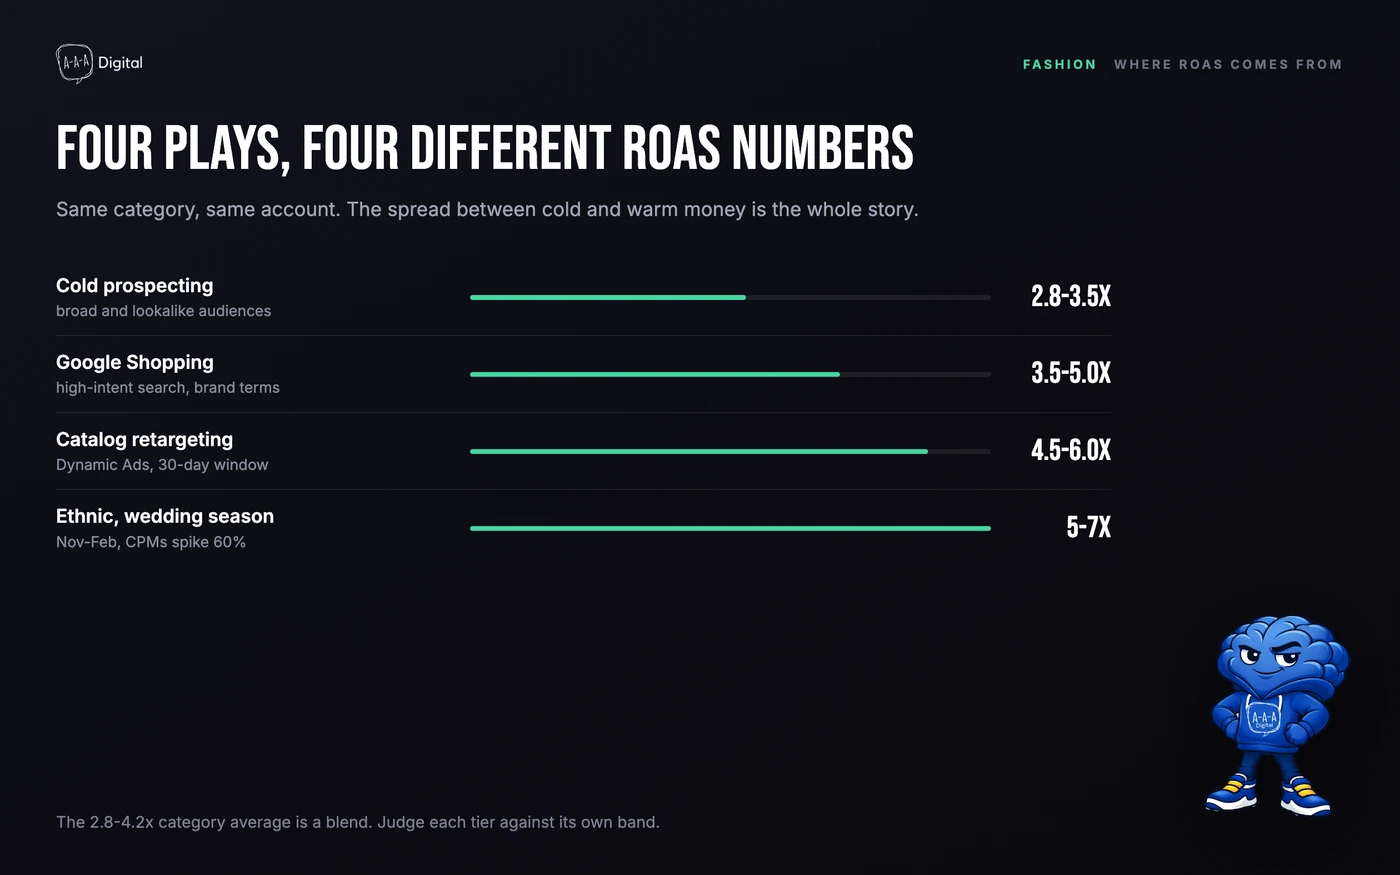
If you remember one thing from this post, make it this: in fashion, the category average ROAS is manufactured by retargeting, and cold prospecting is judged by a different standard.
The report's split is blunt. Catalog-based retargeting through Meta Dynamic Ads delivers 4.5-6.0x ROAS, against 2.8-3.5x for cold prospecting. Same account, same pixel, same creative team. The difference is intent: a shopper who viewed a specific kurta three days ago is orders of magnitude closer to buying than a lookalike audience member who has never heard of you. In a category where the product is visual, seasonal, and scroll-stopping, the catalog ad is not a nice-to-have. It is where the margin lives.
This is why we treat retargeting as infrastructure, not a campaign. Every fashion account we run has the catalog wired as a priority, the retargeting window set to 30 days, and exclusions set so warm audiences never see cold creative. If you want the mechanics of recovering people who already showed intent, our cart abandonment fixes cover the on-store side, and the category-level platform numbers sit in the overview of D2C ROAS benchmarks.
I killed a ₹3 lakh a month cold prospecting budget last year, and I would do it again. The brand, a women's western wear label I will keep anonymous, was spending 70% of budget on broad audiences at 2.4x blended, bleeding cash after returns. We flipped the mix: catalog retargeting and engaged audiences first, prospecting only at proven creative winners, budget floor of ₹2-4L a month as the report recommends. Blended ROAS went from 2.4x to 3.6x in eight weeks, and the account started holding margin after RTO for the first time. Nothing about the product changed. The order of operations did.
The other piece of the mix is Google Shopping at roughly 20% of spend, against Meta's 80%. Shopping catches high-intent searches, brand terms, and the "kurti for office wear" queries that Meta cold audiences approximate poorly. Below the ₹2-4L a month floor, none of this works, because the retargeting pool never fills and every rupee behaves like cold money.
The RTO Reality: Where Fashion Margins Actually Die
Here is the number that decides whether a fashion D2C brand in India is a business or a bonfire: RTO, return to origin, the share of shipped orders that come back undelivered. Fashion runs at 20-30% category-wide, the highest of any category in the report. Women's ethnic runs 25-35%. And COD, at 50-60% of fashion orders, is the fuel. A prepaid customer who changed their mind still has to initiate a return. A COD customer just says no at the door.
The report says it better than I can: if your RTO is above 25%, you are not running a business, you are running a charity for courier companies. I have quoted that line to three clients this quarter, and every one of them nodded before arguing.
Do the math on a single ethnic wear order. Selling price ₹899. CAC somewhere in the ₹280-520 blended band. Two-way shipping on a refused COD parcel, ₹140-180 depending on the courier partner and zone. Packaging, payment gateway fees on the attempt, the warehouse slot for restocking, and the refurb cost on a garment that came back in a crushed polybag. By the time the parcel is back on the shelf you have spent the acquisition cost twice and hold inventory that has lost a week of its selling season. We walk through the full version of this arithmetic in our post on D2C unit economics in India, and the short version is that an order with 30% RTO needs roughly 40% more front-end revenue to make the same profit as the same order at 10% RTO.
I once watched a women's ethnic brand do almost everything right on the ads side, 4.1x blended ROAS, creative refreshed weekly, catalog campaigns humming, and still lose money every month. The leak was pure operations: no order confirmation, COD open to every pincode in the country, one-size-fits-all size charts. Their RTO was 31%. We did not fix that with ads, and no agency can.
The RTO Playbook: Operations, Not Ads
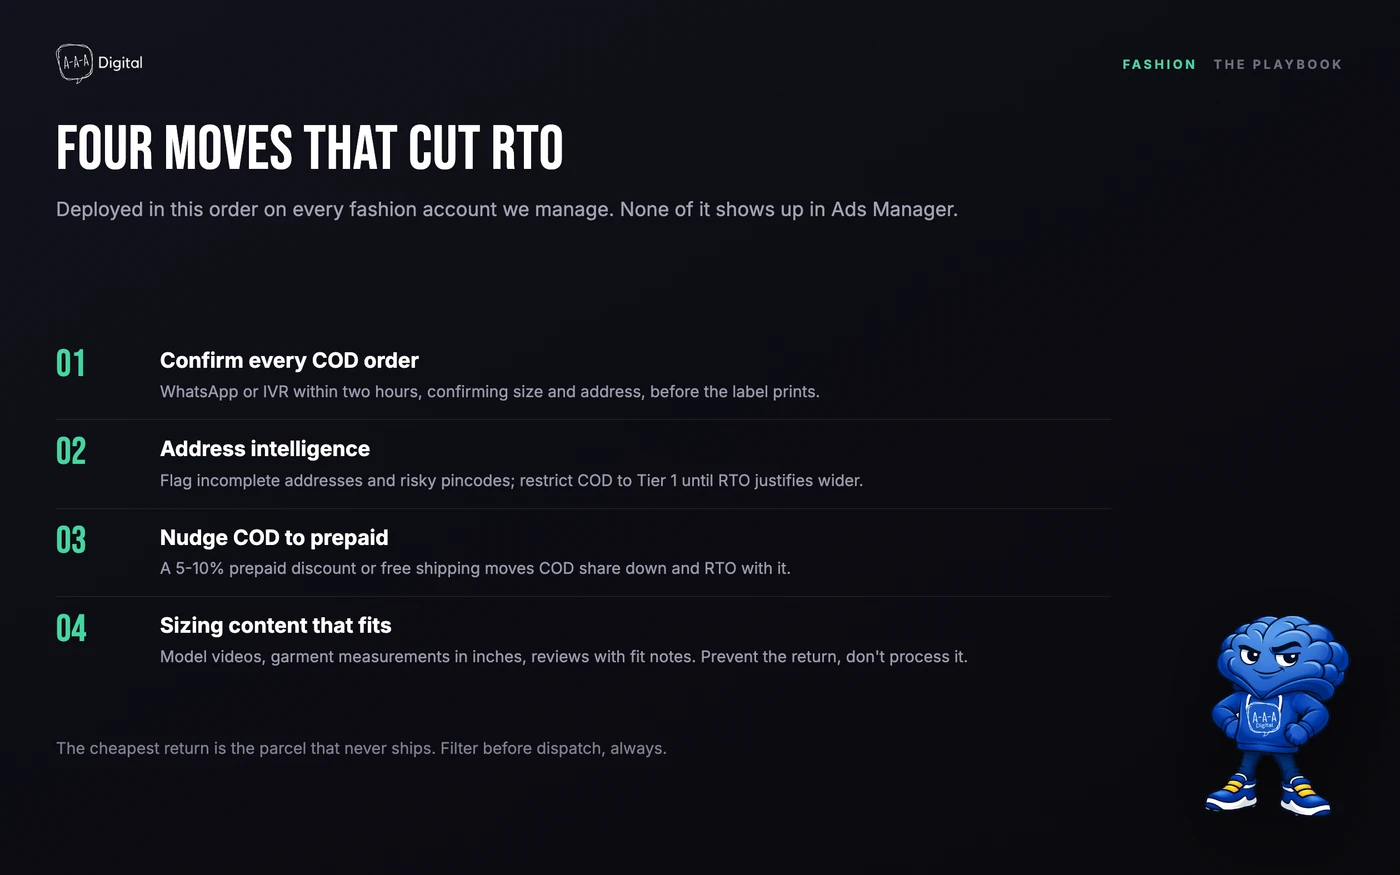
The fix for RTO is boring, which is exactly why it works. Four moves, in the order we deploy them on fashion accounts.
1. Confirm every COD order before it ships. WhatsApp or IVR confirmation within two hours of order placement, asking the customer to confirm size, address, and intent. Not a formality, a filter. Orders that go silent at this stage get cancelled before the label prints, which is the cheapest return you will ever process. On the accounts where we run this, 8-15% of COD orders cancel at confirmation, and those were never real orders.
2. Bring address intelligence into the flow. Incomplete addresses, "near temple" landmark nonsense, and pincode-level risk scoring belong in your ops stack before dispatch. The report's recommendation is explicit: use AI-based COD verification, call before ship, or restrict COD to Tier 1 pin codes only until your RTO justifies going wider. Brands resist this because it feels like turning away revenue. It is actually turning away shipping costs.
3. Nudge COD toward prepaid. A 5-10% prepaid discount, free shipping on prepaid, or a small coupon on the next order for choosing prepaid. Prepaid orders RTO at a fraction of COD, and even a 10-point shift in the COD share moves blended RTO by several points. Do not remove COD entirely; in Tier 2 and Tier 3 India, COD is the trust mechanism, and removing it kills conversion harder than RTO does.
4. Publish sizing content that prevents the return. This is the one nobody wants to fund because it is not an ad. Model videos on the product page, not flat lays, so shoppers see drape and fit on a body. Size charts with garment measurements in inches, not vanity sizes. Reviews seeded with fit notes ("runs small, size up"). The report's creative guidance says it plainly: model videos, not flat lays. Sizing-driven returns are the share of RTO you control before the courier is ever involved.
None of this shows up in Ads Manager. All of it shows up in the bank account.
Creative and Seasonality: Where Fashion Ad Accounts Actually Win
Two closing notes from the creative side, because in this category the creative is the targeting.
First, the report's instruction is model videos, not flat lays, and our account data agrees every single month. A flat lay tells the shopper what the product is. A model video tells them what it looks like on a body that moves, which is the question every fashion buyer is actually asking. UGC-style try-on reels with regional language voiceovers routinely beat studio flat lays on CTR and on cost per purchase in the same ad set. Creative fatigue also arrives faster in fashion than anywhere else; plan to refresh hooks every two to three weeks, not quarterly.
Second, seasonality is a weapon, not a weather report. Wedding season from November to February plus Eid and Rakhi drive ethnic wear CPMs up 60%, but the same window pushes ethnic ROAS to 5-7x. The brands that win that window stocked 45 days early, locked their catalog campaigns before CPMs spiked, and held prospecting budgets steady while competitors panic-raised bids. The brands that lose it are still approving creatives in mid-December.
FAQ
What is a good ROAS for fashion D2C in India?
Depends entirely on which number you mean. For catalog retargeting, 4.5-6.0x is the healthy band, and anything under 4x usually means a weak catalog feed or a retargeting window set too tight. For cold prospecting on Meta, 2.8-3.5x is the benchmark, and some healthy accounts run slightly below that while retargeting carries the blend. For blended, the category sits at 2.8-4.2x on Meta. Judge each tier against its own range, not against the blended number, or you will cut the prospecting that feeds next month's retargeting pool.
Why is RTO so high in fashion?
Three reasons stack on top of each other. COD is 50-60% of fashion orders, and refusing a parcel at the door costs the customer nothing. Sizing is inconsistent across brands, so fit disappointment is structurally common, especially in women's wear. And fashion purchases are often impulse-driven and occasion-specific; the wedding passes, the mood passes, the parcel comes back. Ethnic wear combines all three, which is why it runs 25-35% RTO while sustainable fashion runs 16-24%.
How much monthly budget does a fashion D2C brand need for ads?
The report's floor is ₹2-4L per month, and we treat it as a real constraint rather than a guideline. Below that, the retargeting pool never fills, every campaign behaves like cold money, and you cannot gather creative learnings fast enough to matter. Above it, the split that works for most fashion accounts is roughly 80% Meta and 20% Google Shopping, with prospecting funded only after catalog retargeting is fully built out.
Meta or Google Shopping for a fashion brand?
Meta first, Google Shopping second, and the report's 80/20 mix reflects that. Meta is where discovery happens for fashion; nobody searches for a dress they have not imagined yet. Google Shopping earns its 20% by catching high-intent searches, brand queries, and comparison shoppers who are already close to buying. If you have to pick one because of budget, pick Meta, but know that you are building a business on rented interruption, which is exactly why RTO discipline matters so much.
Where Fashion Brands Should Start
If your fashion account is under its benchmarks, resist the urge to touch the ads first. Pull your RTO by subcategory and by payment method, build the confirmation and address filters, then re-read your ROAS. Most fashion accounts we audit do not have an advertising problem; they have a returns problem wearing an advertising costume.
The full category numbers, all twelve segments and the ten fashion subcategories, live in the 2026 D2C benchmarks report. If you want a team that treats RTO as a media buying problem, not an afterthought, talk to our performance marketing team and we will audit your funnel in that order.
