
Last quarter, a Shopify brand doing about $180,000 a month came to us with a complaint we hear every week: their dashboard count had tripled, but their clarity had gone to zero. Meta Ads Manager said paid social drove the month. Google Ads claimed most of the same customers. GA4 reported revenue 22% below what Shopify showed, and a $1,500-a-month attribution tool told a third story that matched neither.
None of the tools were broken. The stack was simply nobody's job. Each tool had been installed at a different growth stage by a different person, and nobody had ever decided which number was the truth when they disagreed.
That is the state of ecommerce analytics in 2026 for most stores: an abundance of data and a shortage of decisions. iOS privacy changes, ad blockers, consent regulation, and GA4's modeling mean every individual tool now sees a partial picture. The stores that win are not the ones with the most tools. They are the ones with a deliberate measurement system. This guide is that system: the four-layer stack, the metrics hierarchy from north star down to diagnostics, attribution reality, the reporting cadence that gets read, and the five setup mistakes that quietly corrupt everything downstream.
The Ecommerce Analytics Stack: Four Layers, One Truth
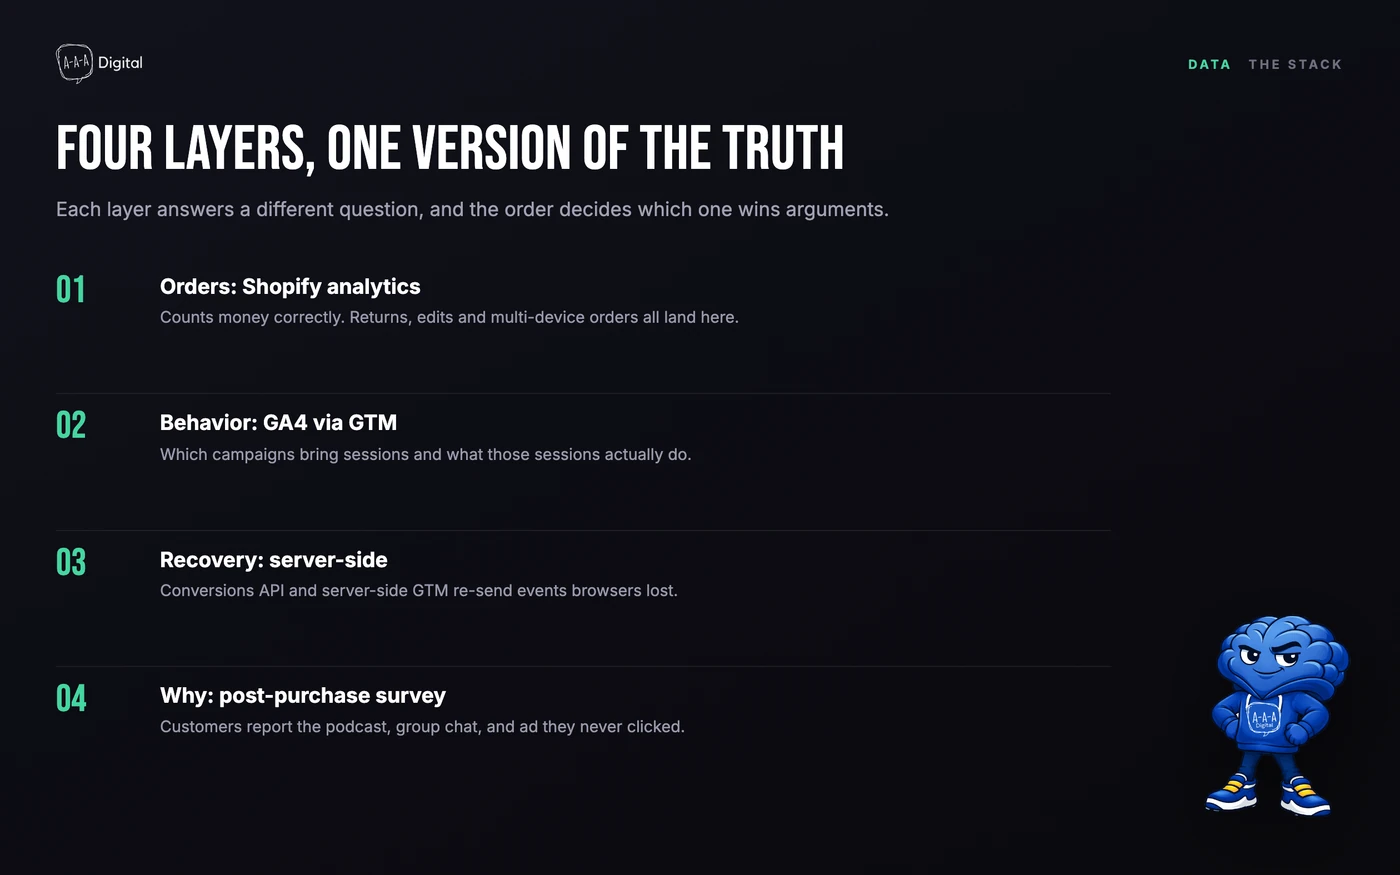
Every store we audit has the same shape of problem: one layer of the stack missing, another layer compensating badly. Here is the full stack we deploy on Shopify stores, in order of importance.
Layer 1: Shopify analytics, the order truth. Shopify's native reports are the only system that counts money correctly, because it counts orders, not browser events. Returns, exchanges, edits, and multi-device purchases all land here. We treat Shopify as the financial source of truth and make every other tool reconcile against it. What Shopify can't tell you is why orders happen or which marketing deserves credit, which is what the other three layers are for.
Layer 2: GA4 through Google Tag Manager, the behavior truth. GA4 answers questions Shopify can't: which campaigns bring sessions, what those sessions do, and where the funnel leaks. Two things matter in 2026. First, the default attribution model is now data-driven (Google made the switch in late 2023), and first-click has been dropped from event-scoped reporting, so your channel numbers are increasingly a model's opinion rather than a fact. Second, the implementation has to be deliberate: the native integration alone under-reports, while a pile of apps firing their own tags double-reports. The exact configuration we use, down to the event settings that bring GA4 purchase numbers within a few percent of Shopify, is in our Google Analytics 4 setup for Shopify. For clients who want tag control without a developer ticket each time, we put Google Tag Manager at the center of the Shopify setup and treat it as the firewall that stops apps from double-firing.
Layer 3: Server-side tracking, the recovery layer. Browsers lose events. Ad blockers run on roughly 30% of devices globally (GWI's Q2 2025 survey puts the figure near 29.5%), iOS privacy features strip identifiers, and consent banners hold tags until a visitor decides. Commonly cited industry estimates put the lost share of events anywhere from 15% to 30%, and the honest answer is that nobody knows their exact number. Server-side tracking (the Meta Conversions API, Google Ads enhanced conversions, and server-side GTM for GA4) re-sends what the browser dropped. It does not recover everything, but it is the difference between a 60% picture and an 85% one.
Layer 4: Post-purchase surveys, the human truth. Ask "how did you hear about us?" on the order confirmation page and you get the answer no cookie can: the podcast, the group chat, the third Google search, the TikTok they watched but never clicked. We treat survey responses as the tiebreaker whenever platform numbers and GA4 disagree, and they disagree often enough that this layer pays for itself in the first budget meeting.
The Ecommerce Metrics Hierarchy: North Star to Diagnostics
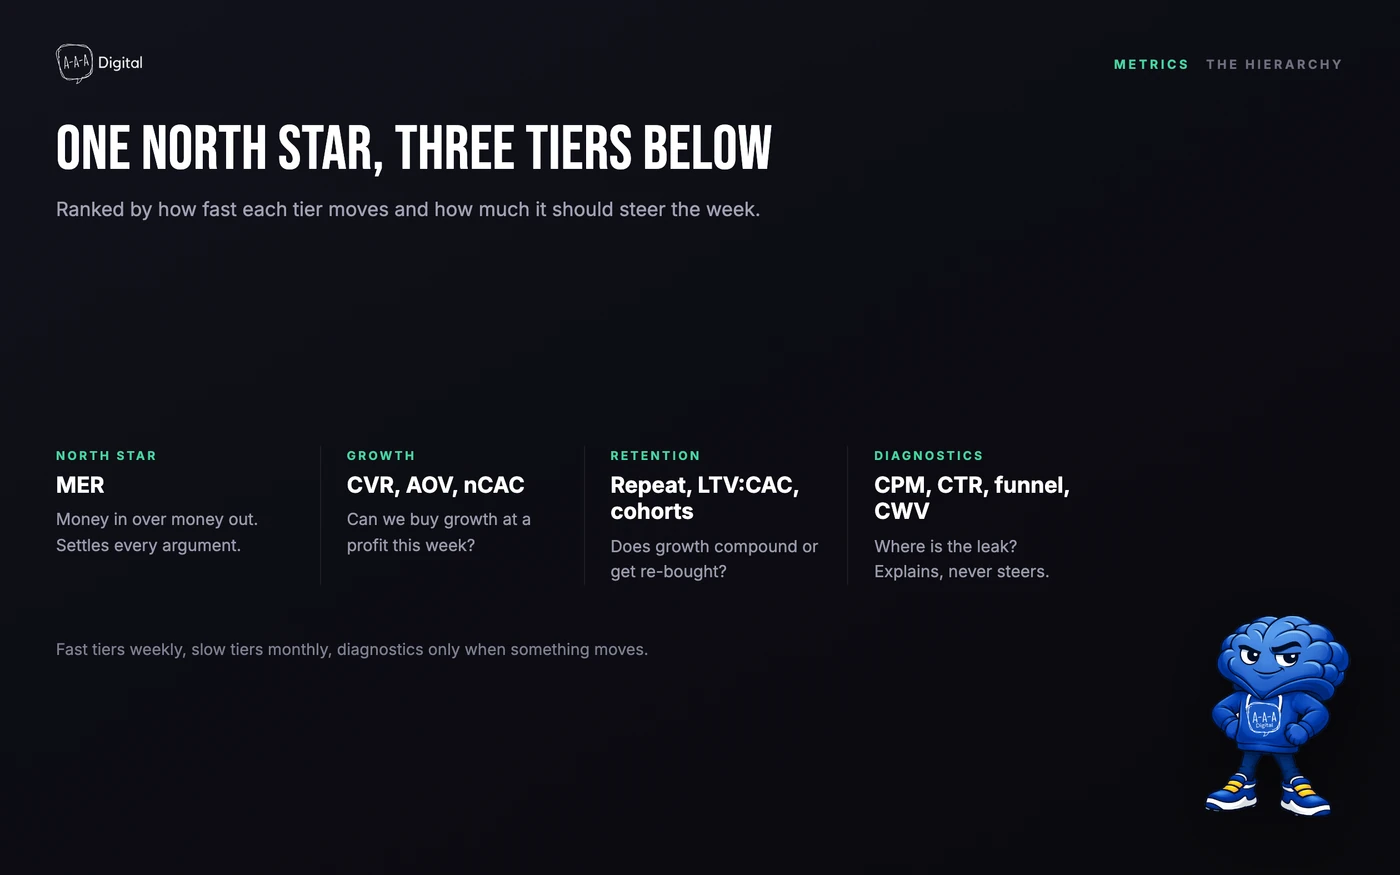
The second failure pattern we see is metric soup: thirty numbers on a dashboard, none of them ranked. When everything is a KPI, nothing is. The fix is a hierarchy with one north star, and every other number slotted beneath it as a growth metric, a retention metric, or a diagnostic.
| Tier | Metrics | The question they answer | Cadence |
|---|---|---|---|
| North star | MER | Is the whole machine efficient? | Weekly |
| Growth | Conversion rate, AOV, nCAC | Can we buy growth profitably? | Weekly |
| Retention | Repeat rate, LTV:CAC, cohort retention | Does growth compound, or do we re-buy the same customer? | Monthly |
| Diagnostics | CPM, CTR, funnel step rates, Core Web Vitals | Where exactly is the leak this week? | Weekly, as needed |
MER earns the north star slot because it is bank-account math. Marketing efficiency ratio is total revenue divided by total marketing spend, and it ignores attribution entirely: money in, money out, no model's opinion in between. Benchmarks for profitable DTC brands typically land between 2.5x and 4x, but the correct target comes from your margins, not someone else's store. Below your floor for more than a couple of weeks, the machine is losing efficiency, and the tiers below tell you where.
The growth tier carries the weekly operational weight. Conversion rate decides whether traffic is worth buying at all. Average order value decides how much you can afford to pay for a session. New customer CAC, computed as total spend over first-time customers rather than the blended figure platforms prefer, decides whether growth is bought at a profit or a loss. We covered the mechanics of that number in our guide to customer acquisition cost in ecommerce; the short version is that blended CAC flatters you a little more every month your brand grows.
The retention tier is where the actual business gets built. Repeat purchase rate, lifetime value against CAC, and cohort retention curves (what share of January's customers are still buying in July) tell you whether you own a customer base or rent one from ad platforms. These move slowly, which is why they get a monthly cadence instead of a weekly one.
Diagnostics are smoke alarms, not strategy: CPMs, click-through rates, add-to-cart and checkout step rates, site speed. They explain movements in the tiers above them. They never set direction on their own, and a weekly meeting that debates diagnostics while the north star drifts is a meeting wasted.
If this skeleton looks familiar, it is the same frame as the eight-metric weekly scorecard in our DTC metrics dashboard guide. That post is the operating version; this one is the system it hangs from.
Ecommerce Attribution in 2026: Triangulate or Guess
Here is the uncomfortable summary of attribution in 2026: last-click is dead, and every replacement is an estimate. Apple's App Tracking Transparency, introduced with iOS 14.5 in 2021, made cross-app tracking opt-in, and published opt-in rates vary so widely by methodology that quoting a single figure would be dishonest: Singular put the global rate near 14% in mid-2024, while AppsFlyer has reported roughly half of users opting in. Around 30% of sessions run ad blockers. In the EEA and UK, Google has required Consent Mode v2 since March 2024 for advertising and measurement features to keep working properly, and a meaningful share of visitors decline.
Meanwhile, GA4 defaults to data-driven attribution, which distributes credit with a model you did not choose and cannot fully inspect, and every ad platform still grades its own homework: counting view-through conversions, claiming sales other platforms also claim, and overstating its role in the journey. Add the platform numbers together and they routinely exceed your actual revenue, which is arithmetically impossible and somehow still appears in board decks.
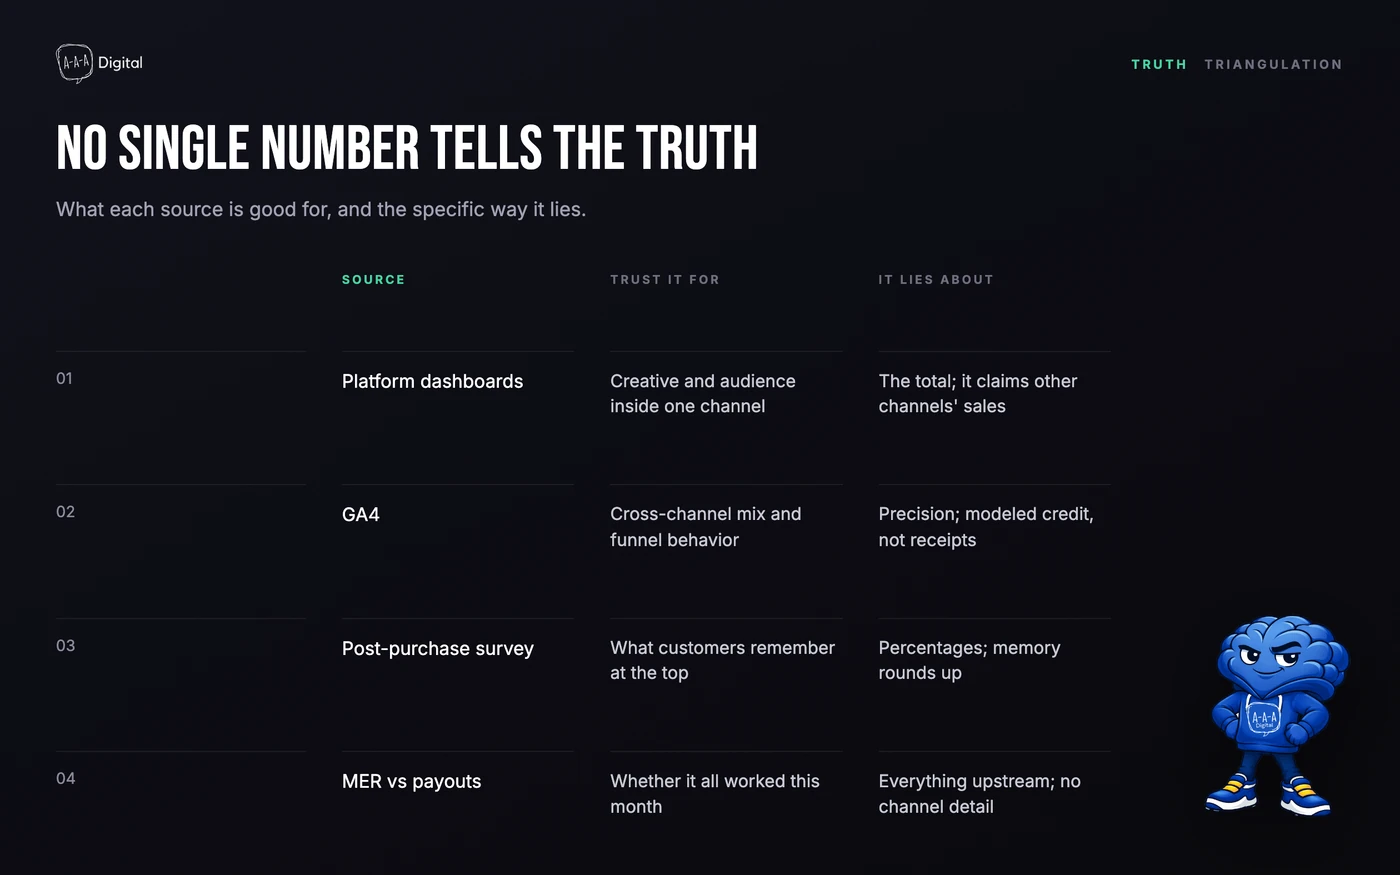
Our working answer is triangulation. No single source gets believed, and every budget decision has to survive three lenses.
- Platform dashboards tell you what is working inside a channel: which creative, which audience, which keyword. Directionally useful within the platform, useless as a total.
- GA4 tells you how channels combine across the journey, modeling caveats included. Useful for the mix, not for the invoice.
- Post-purchase surveys tell you what customers remember, the closest thing to ground truth at the top of the funnel.
- MER against payouts settles every argument at month end. Platforms disagree; your bank account does not.
When a decision is big enough to matter, doubling spend on a channel or cutting one, we validate with a holdout or geo incrementality test rather than trusting any of the above. That discipline, demanding evidence before money moves, is the same one behind how we approach measuring SEO ROI: modeled numbers guide the weekly work, but budgets move on tests and bank statements.
The Reporting Cadence That Actually Gets Read
Analytics systems fail socially more often than technically: the report exists, and nobody has opened it in a month. The fix is a cadence matched to how fast each tier of the hierarchy moves.
The weekly snapshot: 30 minutes, eight numbers. Same day every week (we like Monday morning), same spreadsheet, the eight metrics from the scorecard post, and one line next to each: why it moved. Eight numbers plus eight sentences fits in half an hour, and the sentence matters more than the number, because writing it forces an explanation instead of a glance.
The monthly deep dive: 90 minutes, three documents. First, MER trend against target with the growth tier beneath it to explain the movement. Second, cohort retention curves and repeat rate, because retention problems are cheapest to fix in the month they appear. Third, survey answers set against platform claims: if 40% of customers say TikTok but Meta gets credit for 12% of conversions, that gap is next month's budget conversation.
The quarterly audit: tracking plus one big test. Re-run a test order through the whole funnel and compare every system's count against Shopify. Check for duplicate tags, new apps injecting their own pixels, consent banner behavior in a fresh browser. Then pick the single channel-level disagreement that matters most and settle it with a holdout test.
We learned the cadence lesson the hard way. Years ago our weekly client reports ran twelve pages, and nobody read them. The reports that changed behavior were the short ones with three numbers circled and a decision attached. Volume is not diligence, and a report that gets skimmed is worse than no report, because it creates the feeling of control without any.
The Five Setup Mistakes That Ruin Your Data
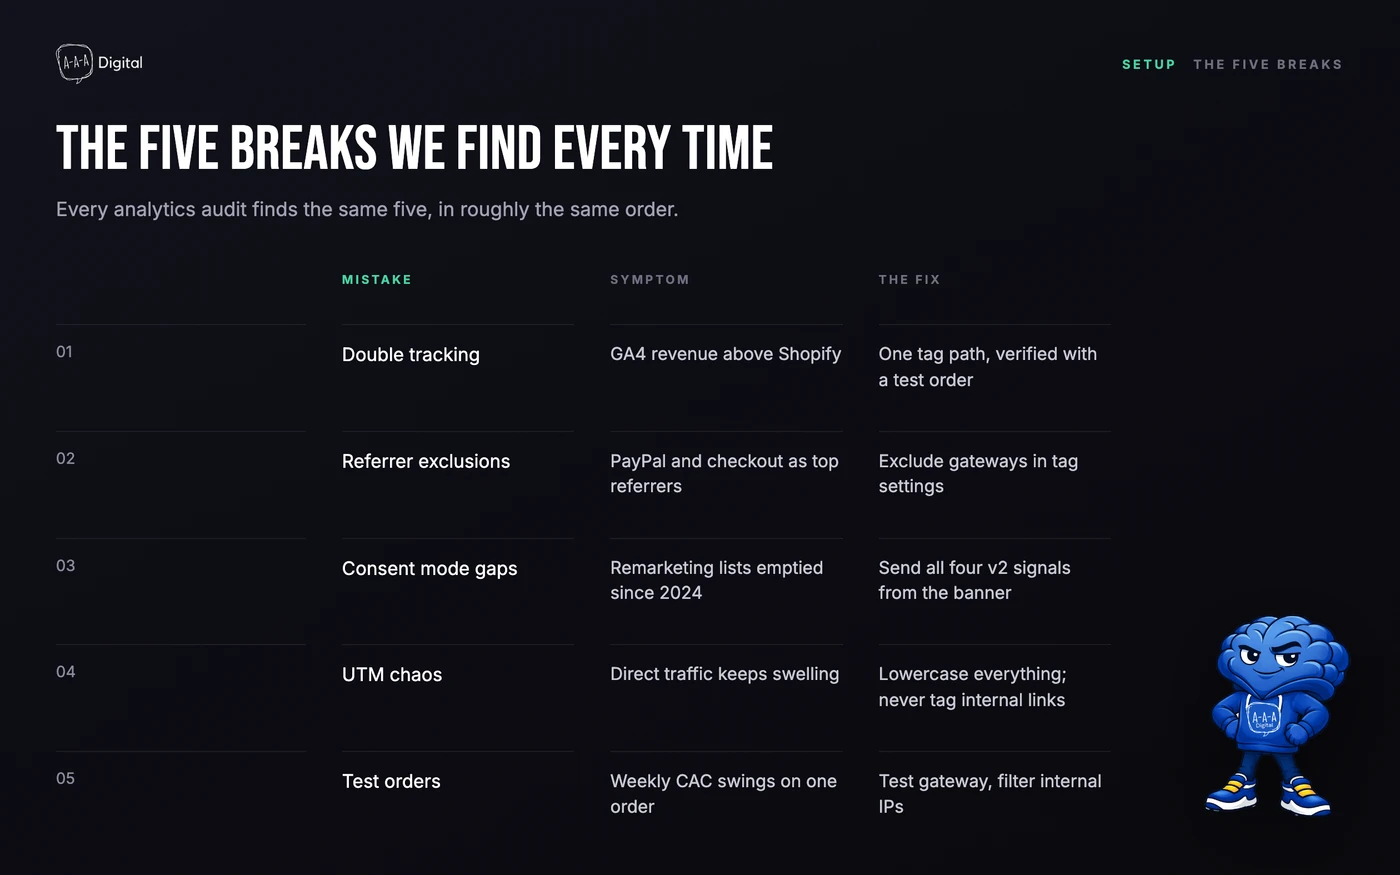
Every analytics audit we run finds the same five breaks, in roughly the same order. If you do nothing else after this guide, fix these.
1. Double tracking. The most common: Shopify's native GA4 integration plus an app, a theme snippet, or an old gtag all firing purchase events. GA4 revenue reads 50% to 100% high, every channel looks slightly better than it is, and the fake growth is impossible to diagnose later. Symptom: GA4 revenue above Shopify. We once watched a client celebrate a record month in GA4 while Shopify showed a perfectly ordinary one; a single duplicate tag was the entire celebration.
2. Missing referrer exclusions. Payment gateways and checkout domains (paypal.com, checkout.shopify.com, shop.app) appear as top referrers and split real sessions in two, usually crediting the purchase to "referral" instead of the campaign that brought the customer. The fix takes about ten minutes in your tag settings, and most stores have never done it.
3. Consent mode misconfiguration. If you sell to the EEA or UK and your setup does not send all four Consent Mode v2 signals (ad_storage, analytics_storage, ad_user_data, ad_personalization), Google's advertising features have been quietly degrading since March 2024: remarketing lists stop populating and conversion modeling weakens. If you show a consent banner to everyone but never wire the choice into your tags, you pay the conversion cost of consent without getting any of the data benefit.
4. UTM chaos. Internal links tagged like campaigns, inconsistent capitalization, email flows with no UTM at all. The result is a swelling "direct" bucket that hides your best channels. One rule fixes most of it: UTMs describe the source of the click, never the page the click sits on, and lowercase everything.
5. Test orders and staff traffic. One $5,000 test order can move a small store's weekly CAC by a third. Filter internal IPs in GA4, use Shopify's test payment gateway instead of a real card, and keep your team's purchases out of every paid-attribution view. Boring, and worth real money.
If two or more of these sounded familiar, your dashboards are not opinions at this point, they are fiction, and every budget decision built on them is a coin flip. The good news: this is fixable in days, not months. In our Shopify CRO work, the tracking autopsy always comes first, because optimizing a store against broken data just produces broken results faster.
FAQ
What is the best analytics setup for a Shopify store?
There is no single best tool, because each layer answers a different question. Use Shopify's native analytics for order truth, GA4 with Google Tag Manager for behavior, server-side tracking to recover lost events, and a post-purchase survey for attribution. Stores that pick one tool and demand everything from it end up with the dashboards that disagree.
Is GA4 accurate enough for ecommerce?
Accurate enough for direction, never for invoices. A gap of 10-20% between GA4 and Shopify revenue is normal; beyond that, suspect duplicate events or consent configuration. Use GA4 to understand the funnel and the channel mix, and reconcile purchase counts against Shopify before letting any GA4 revenue figure into a budget decision.
What is a good MER for ecommerce?
Benchmarks for profitable DTC brands typically sit between 2.5x and 4x, but your target should come from your own margins. Divide 1 by your contribution margin percentage to find the MER where you break even, then add the profit you need on top. A 4x MER can still lose money on a low-margin store, which is why the benchmark is a starting point, not a target.
How do I measure marketing performance after the iOS privacy changes?
Stop expecting any single tool to do it, and triangulate instead. Use platform dashboards for in-channel decisions, GA4 for the cross-channel picture, post-purchase surveys for what customers remember, and MER against actual revenue as the final judge. For budget moves that are large or hard to reverse, run a holdout or geo incrementality test.
Get Help With This
If this guide mapped cleanly onto problems you recognize, the next step is a measurement audit: one week, a test order through your entire funnel, and a written list of what your data gets wrong and in what order to fix it. Talk to us about Shopify CRO and we will start exactly there, because every conversion project we run begins by making sure the numbers we optimize against are real.
